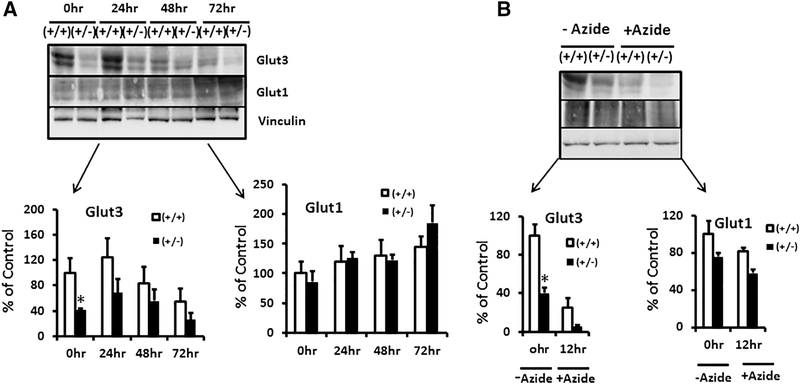
Figure 10. Hypoxia and inhibition of oxidative phosphorylation on embryonic stem cells.
A. Effect of hypoxia on Glut1 and Glut3 protein concentrations at different time points (0hr, 24hr, 48hr and 72hrs). n=3/genotype. *p< 0.05 vs glut3+/+ ES cells. B. Sodium azide treatment inhibiting oxidative phosphorylation in ES cells. The insets demonstrate Western blots showing Glut1, Glut3 and vinculin (internal control) protein bands in glut3+/+ and glut3+/− ES cells in presence (+) or absence (-) of sodium azide, while densitometric quantification of the Glut proteins/vinculin protein, depicted as a percent of the corresponding glut3+/+ ES values is depicted below. *p<0.05 vs glut3+/+ ES cells.

