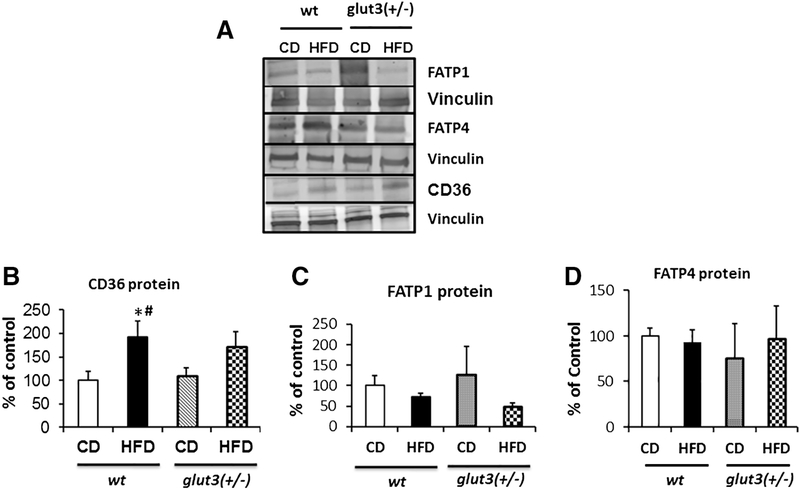
Figure 5. Placental Fatty acid transporters.
Representative Western blots showing FATP1, FATP4 and CD36 protein bands with vinculin as the internal loading control (A) are in the inset, while quantification is shown below. Fisher’s PLSD is as follows: F value (2.57), wtHFD vs *wtCD (p=0.01), wtHFD vs #glut3+/−CD (p=0.03).

