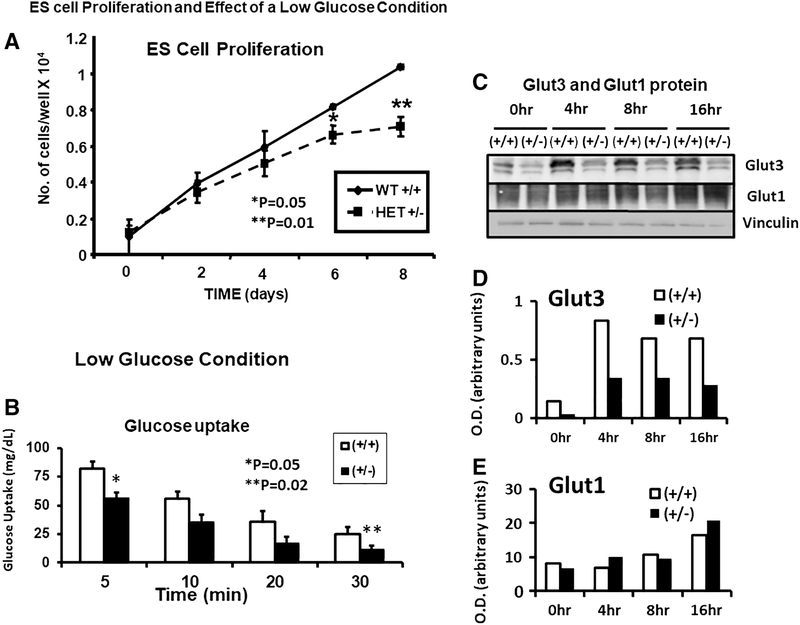
Figure 9. Embryonic stem cell growth, glucose uptake and glucose transporters.
A. Growth curves of glut3+/+ and glut3+/− ES cells is shown.*p<0.05. **P<0.01 vs glut3+/+ ES cells. B. Glucose uptake in glut3+/+ and glut3+/− ES cells is shown. Cells were initially grown in Knockout DMEM containing 25mM glucose + LIF, next day this media was removed and the cells washed with PBS twice followed by addition of the same media containing 2.5 mM glucose (low glucose) + 2-deoxy-[14C]glucose. ES cells were collected at different time points (5min, 10min, 20min and 30min) and the glucose uptake measured. *p<0.05, **p<0.02 vs glut3+/+ ES cells. n=3/genotype. C. Glut3 and Glut1 proteins at different and longer time intervals under the same low glucose conditions are depicted with vinculin serving as the internal loading control. Quantification of D. Glut3 and E. Glut1 proteins as a ratio to vinculin is expressed as optical density (O.D.) in arbitrary units.

