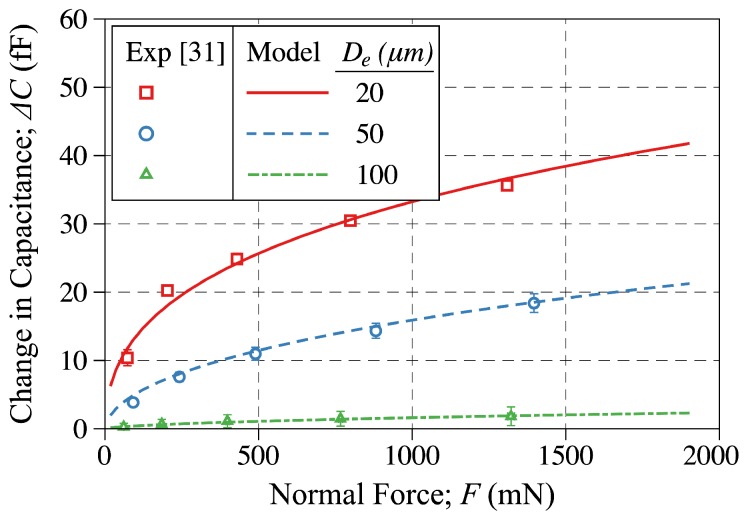
Figure 12.
The change-in-capacitance plotted against the applied force. The discrete points are showing the experimental measurements reported in [31], while the solid line is showing the modeling results obtained in this study. The model predictions are reported for and for electrode gaps of and 100 μm, respectively.

