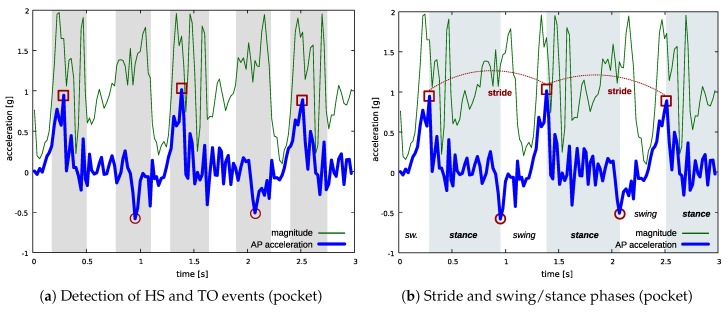
Figure 7.
Detection of gait parameters at the pocket position. In (a): shaded areas highlight the intervals identified by the walking detection algorithm based on acceleration magnitude analysis (sensor steps and contralateral steps); red squares indicate HS events, whereas red circles indicate TO events—both events are detected only for the leg which is carrying the sensor. In (b) the estimated parameters are shown: shaded areas highlight stance periods.

