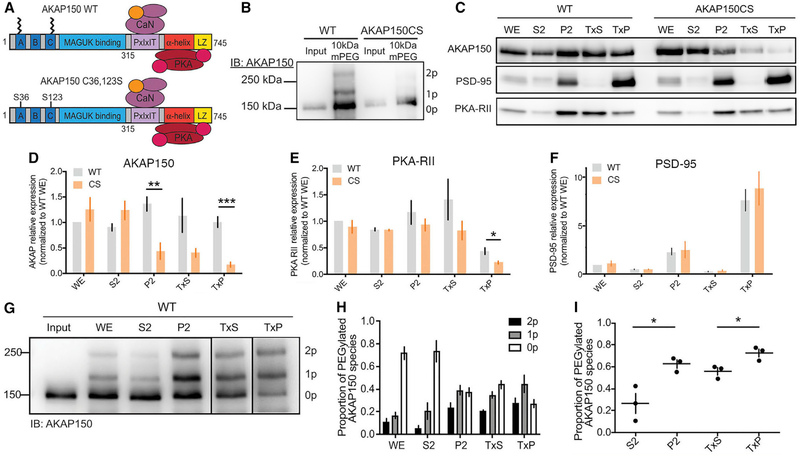
Figure 1. AKAP150 and PKA-RII Levels Are Reduced in PSD-Enriched Fractions from AKAPCS Palmitoylation-Deficient Mice.
(A) Schematic of AKAP150 highlighting binding partners and functional domains. AKAP150 is palmitoylated at Cys 36 and 123, and these residues are mutated to Ser to create the AKAPCS palmitoylation-deficient mutant mouse.
(B) APEGS assay showing that AKAP150 WT, but not CS, is palmitoylated in lysates from mouse brain.
(C) Subcellular fractionation and western blotting from WT and CS P21 mouse hippocampus for AKAP150, PSD-95, and PKA-RIIβ. P2, crude synaptosomes; S2, cytosol and light membranes; TxP, triton-insoluble sub-fraction of P2 = PSD-enriched fraction; TxS, triton-soluble sub-fraction of P2; WE, whole extract.
(D–F) Quantification of subcellular fractionation from (C) normalized to WT WE levels showing (D) decreased AKAP150 protein levels in P2 and TxP fractions from CS mice (P2: WT 1.36 ± 0.14, CS 0.44 ± 0.16, unpaired t test **p = 0.0033; TxP: WT 1.00 ± 0.10, CS 0.17 ± 0.05, unpaired t test ***p = 0.00028; WT n = 5, CS n = 4), (E) decreased PKA-RIIβ protein levels in TxP fractions from CS mice (WT 0.44 ± 0.063, CS = 0.22 ± 0.029, unpaired t test *p = 0.036; n = 3), but (F) no change in fractionation of PSD-95 in CS versus WT mice.
(G) AKAP150 APEGS assay of subcellular fractions from WT mouse forebrain.
(H) Quantification of the proportion of AKAP150 in the unpalmitoylated lower MW band and the mono- and di-palmitoylated higher MW bands across the subcellular fractions in (G).
(I) Quantification of the total proportion of palmitoylated AKAP150 (mono- plus di-) revealing significantly more palmitoylated AKAP150 in P2 versus S2 and TxP versus TxS (S2 0.26 ± 0.16, P2 0.63 ± 0.065, unpaired t test *p = 0.022; TxS 0.56 ± 0.059, TxP 0.73 ± 0.062, unpaired t test *p = 0.028; n = 3).
*p < 0.05, **p < 0.01, and ***p < 0.001 by unpaired t test. Data are reported as mean ± SEM; n = number of animals.

