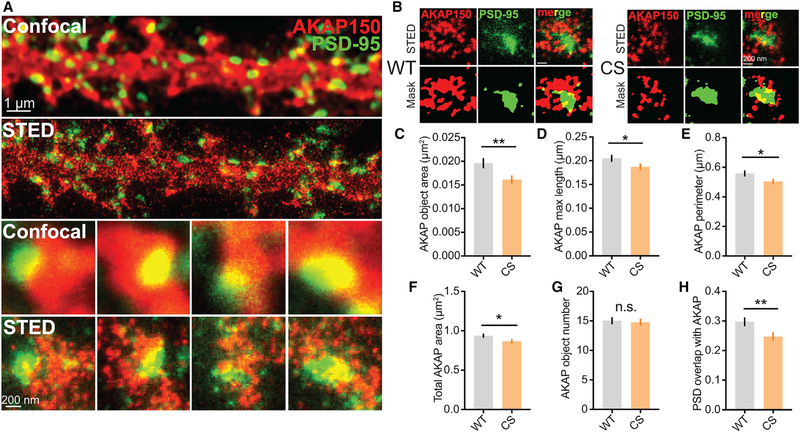
Figure 2. AKAP150CS Localization to the PSD Is Reduced.
(A and B) Confocal and STED imaging (A) and associated segmentation object masks (B) for 14–16 day in vitro (DIV) 14–16 hippocampal cultures from WT and CS mice stained for AKAP150 (red) and PSD-95 (green). STED images show enhanced resolution and provide better sub-synaptic visualization of AKAP150 localization relative to the PSD.
(C–F) Significant decrease in AKAP object area in AKAPCS cultures (C) (WT 0.01961 ± 0.0009 μm2, n = 102 spines; CS 0.01614 ± 0.0007 μm2, n = 106 spines; unpaired t test **p = 0.0043) that was accompanied by decreases in (D) AKAP object major-axis length (WT 0.205 ± 0.006 μm, CS 0.1874 ± 0.006 μm, unpaired t test *p = 0.0344), (E) total AKAP perimeter (WT 0.5585 ± 0.017 μm, CS 0.5034 ± 0.014 μm, *p = 0.0104), and (F) AKAP compartment area within spines (WT 0.9372 ± 0.019 μm2, CS 0.8662 ± 0.019 μm2, unpaired t test *p = 0.0104).
(G and H) No change is seen in AKAP object number per spine (G), but (H) AKAPCS PSD localization is reduced, as indicated by a decrease in AKAP and PSD-95 object overlap (WT 0.2971 ± 0.01, CS 0.2474 ± 0.01, **p = 0.0058).
*p < 0.05 and **p < 0.01 by unpaired t test. Data are reported as mean ± SEM.

