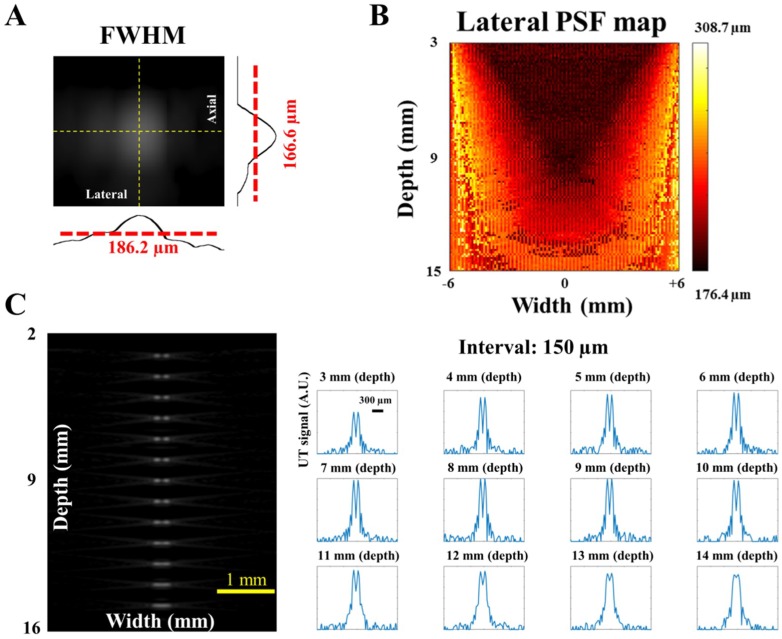
Figure 2.
Simulation of the ultrasound (US) response using Vantage software. (A) The simulated spatial resolutions of one ideal single point scatter at 10-mm depth and the center of the detecting area. The full width at half maximum (FWHM) of this scatter image was calculated as 166.6 μm (axial) and 186.2 μm (lateral). (B) The lateral point spread function (PSF) map of US imaging. The ideal scatter was swept through the entire imaging area (i.e., width: −6 to +6 mm; depth: 3 to 15 mm). The lateral PSF response ranged from 176.4 to 308.7 μm. The imaging resolution decreased when the scatter was at deeper or edge regions. Thus, enough light should be delivered to the depth of 11 mm to acquire PA imaging with consistent imaging quality. (C) Two ideal single point scatters were placed in the imaging area with different intervals to assess the lateral resolution. The two scatters were still distinguishable at a depth of 9 mm when the interval between the two scatters was 150 µm. Note that the scale bar in the 3 mm (depth) subfigure is also applied to other subfigures shown in (C).

