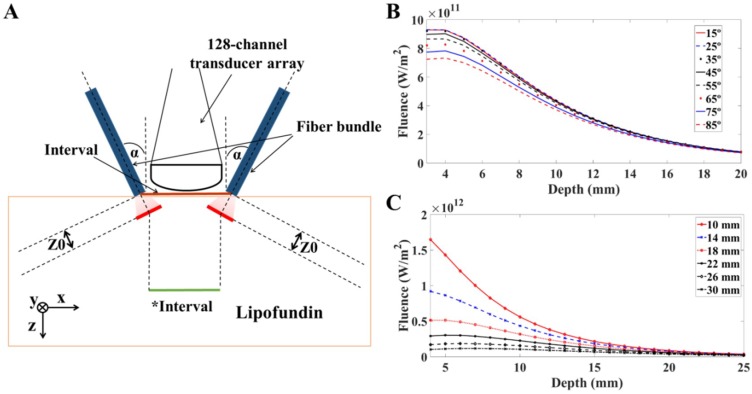
Figure 3.
Schematic and simulation results of fluence in 1% Lipofundin. The simulated laser source was a short pulsed (5 ns pulse width), high-energy (20 mJ per pulse) laser, with Gaussian energy distributed temporally. The output beam dimensions of each fiber bundle arm were 16.5 mm × 0.8 mm. (A) The simulation configuration for light transmission in 1% Lipofundin. is the incident angle of the light sources. Z0 is the transport mean free path. Within the distance of Z0, photons propagate in their original directions with negligible scattering events. The Interval is the distance between the two arms of fiber bundle, while the *Interval is the distance between the central points of the red lines (i.e., the light starts to propagate in the diffusive regime). The detector is a 128-channel transducer array. The interval and incident angle are the two main factors included for evaluation. (B) The changes in light fluence with respect to different incident angles. The interval was fixed at 14 mm. The light fluence decreased with increasing incident angles. However, the differences in light fluence were minimal when the angle ranged from 15 degrees to 35 degrees. (C) The changes in light fluence with respect to different intervals between the two arms of the fiber bundle. The incident angle was fixed at 35 degrees. The fluence value decreased dramatically with an increasing interval from 10 mm to 30 mm. The fluence difference was also reduced as the light propagated deeper into the medium. The results indicated that two arms need to be placed as close together as possible to reach a higher fluence value.

