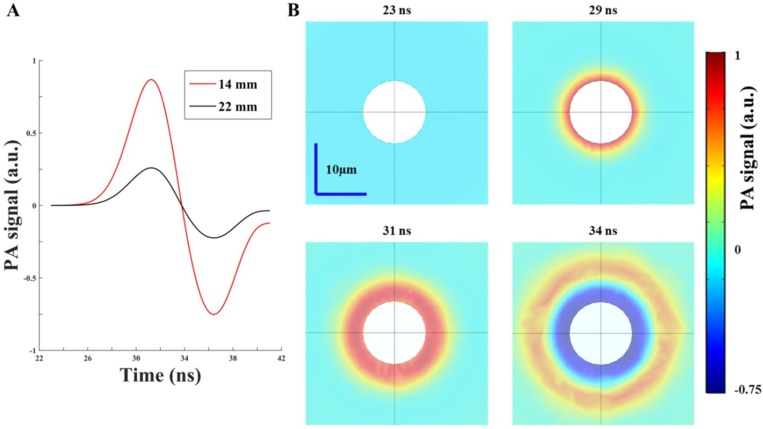
Figure 4.
Simulated photoacoustic (PA) response using COMSOL. (A) The simulated PA signals with different intervals between the two arms of the fiber bundle. The intensity of the PA signal with a 14-mm interval was 3.35-fold larger than the PA signal with a 22-mm interval. (B) The X-Z plane time sequence snapshots of the PA wave field at 4 representative time points in 1% Lipofundin. When the target received a Gaussian light pulse (peak time at 30 ns), the PA wave started to generate from the surface of the target and propagated outward in the scattering medium.

