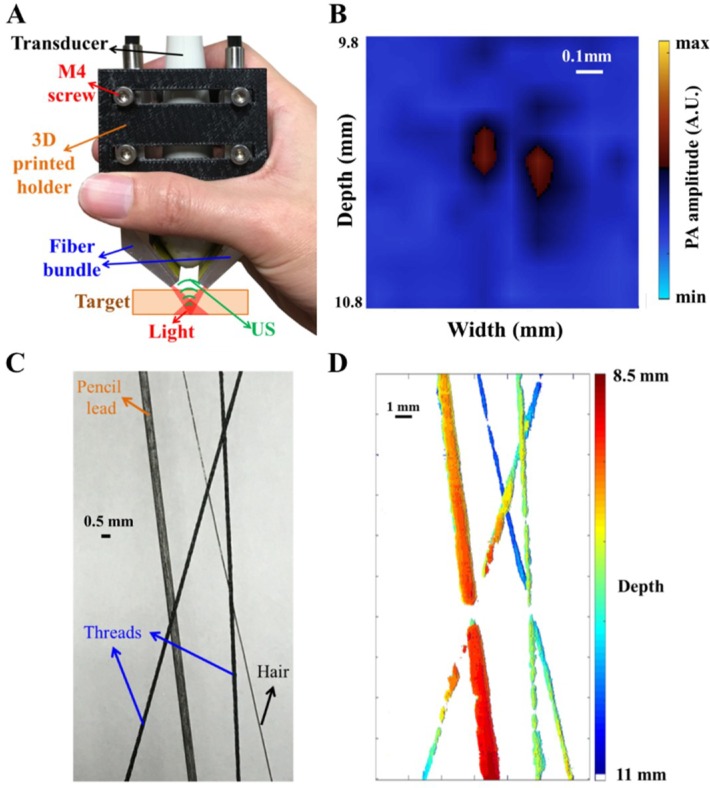
Figure 6.
Photoacoustic (PA) image assessment based on the phantom targets. (A,B) The proof of spatial resolution of the PA imaging system using two thin hairs in 1% Lipofundin. A 3D-printed holder with M4 screws in (A) could be used to fix the fiber bundle and transducer array on the scanning stage or directly used for handheld applications. The dimensions of the handheld probe are 4 cm × 5 cm × 8 cm. (C,D) A photo and color-coded PA image of the designed phantom with depth information. A photo of the designed phantom is shown in (C). The scanning stage was used to scan the entire phantom with a 50-µm step size in the Y direction for acquiring multiple B-scan images, and these images were then reconstructed for the C-scan image as shown in (D). Note that the interrupted image at the cross point of the pencil lead and thread occurred at a shallower depth (shallower than 8.5 mm). Here, we show the reconstructed PA image between 8.5 mm to 11 mm only due to the dark-field illumination scheme of this PA imaging system.

