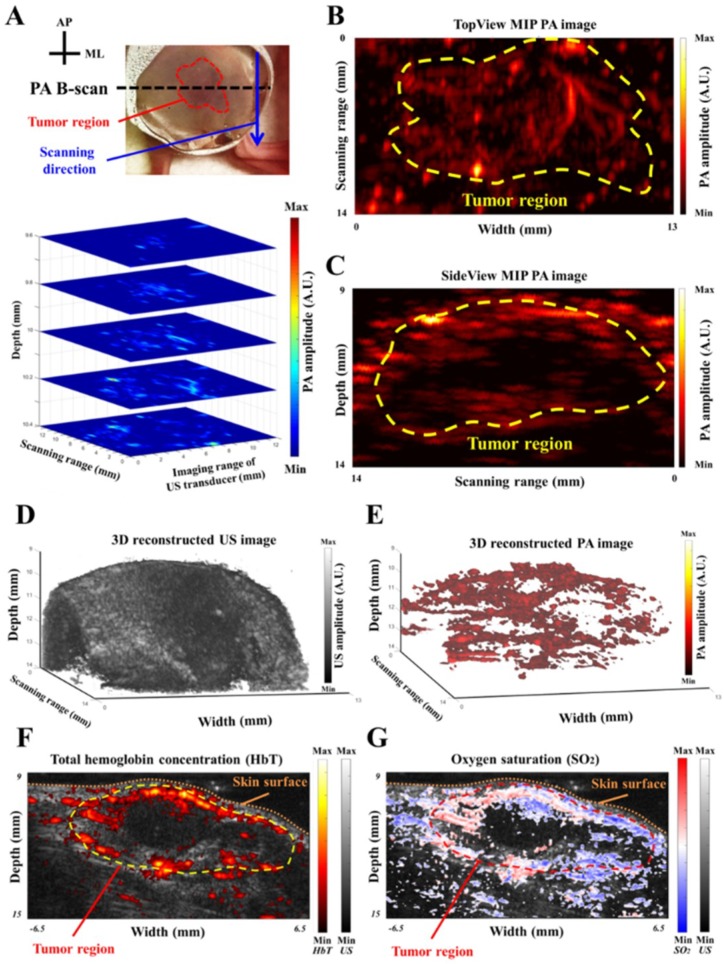
Figure 8.
Subcutaneous tumor evaluation using the developed PA imaging system. (A) The tumor in the right hind leg was imaged by our PA imaging system. The upper subfigure shows that the tumor region (indicated by red dashed line) was scanned in the scanning direction (blue arrow) to acquire multiple X-Z plane PA B-scan images. The lower subfigure demonstrates the reconstructed 5-slice CBV C-scan images in the X-Y plane at different depths. (B,C) The TopView (X-Y plane) and SideView (Y-Z plane) MIP images of the subcutaneous tumor, respectively. Tumor regions are indicated by yellow dashed lines. (D,E) 3D reconstructed US and PA images of the subcutaneous tumor, respectively. (F) A normalized total hemoglobin concentration (HbT)-ultrasound (US) co-registered X-Z plane B-scan image. The distribution of HbT is highly correlated with the subcutaneous tumor profile acquired by US imaging. (G) A normalized oxygen saturation (SO2) image of the subcutaneous tumor. Note that the yellow and red dashed lines indicate the tumor regions in (F) and (G), respectively.

