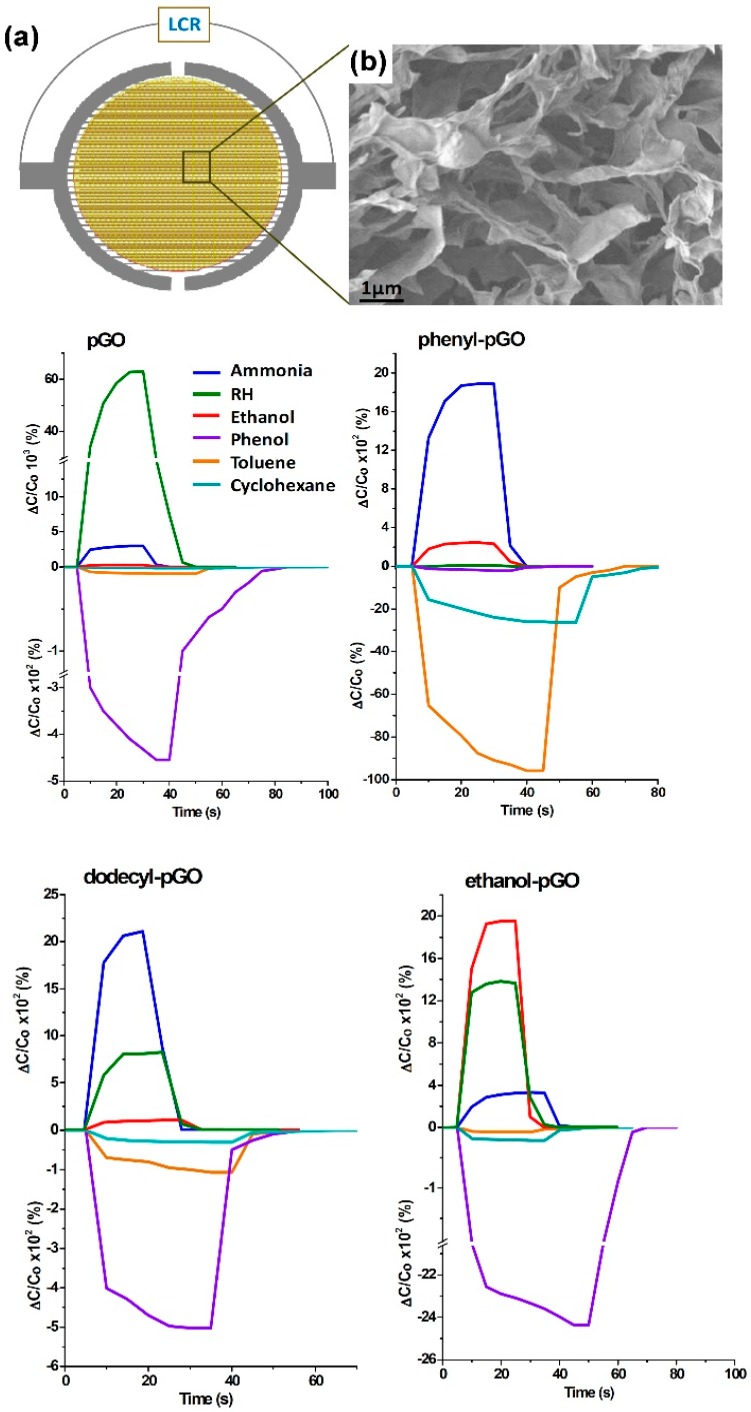
Figure 10.
Panel (a): sketch of the device showing the electrodes and the dielectric porous GO (pGO) between them; Panel (b): SEM image of the pGO network. The graphs report the responses of the not-functionalized (pGO) and phenyl-, dodecyl-, ethanol-functionalized GO sensors to different gas vapours, indicated according to colour code (concentration 180 ppm) and 75% RH. (Adapted and reproduced with permission of RSC Pub., Cambridge, United Kingdom, from [95]; permission conveyed through Copyright Clearence Center, Inc.).

