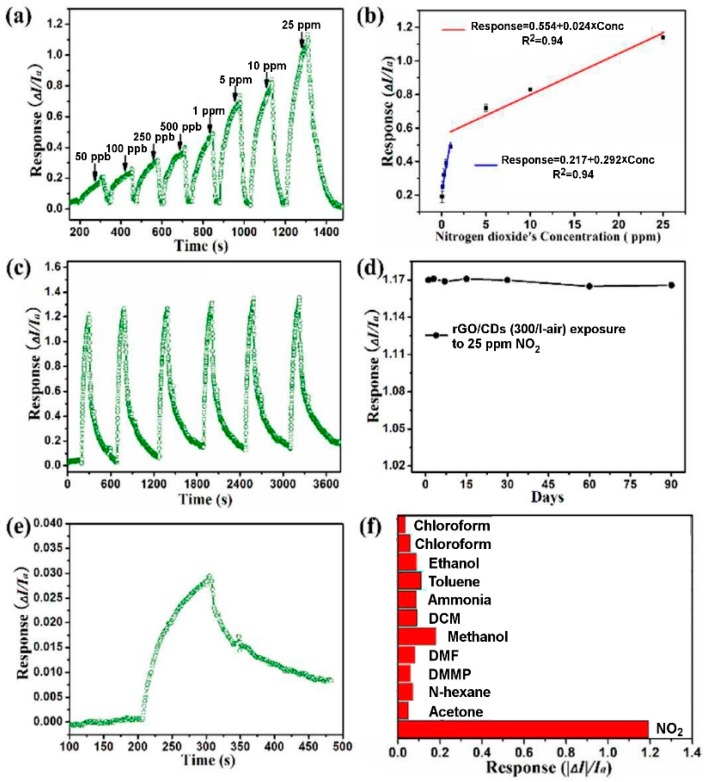
Figure 11.
Panel (a): response of the rGO-CDs sensor to NO2 concentrations ranging from 50 ppb to 25 ppm; Panel (b): calibration curve of the rGO-CDs sensor vs. NO2 concentrations; Panel (c): reproducibility tests of the rGO-CDs sensor; Panel (d): stability of the sensor response over 90 days; Panel (e): response curve upon exposure to 10 ppb of NO2; Panel (f): selectivity of the rGO-CDs sensor: all the bars but the first and the last, are the response of the sensor to 2% of the saturated vapour pressure (SVP) of the labelled gas; the first to 1% SVP chloroform and the last to 25 ppm of NO2. (Adapted and reproduced with permission of RSC Pub., Cambridge, United Kingdom, from [121]; permission conveyed through Copyright Clearence Center, Inc.).

