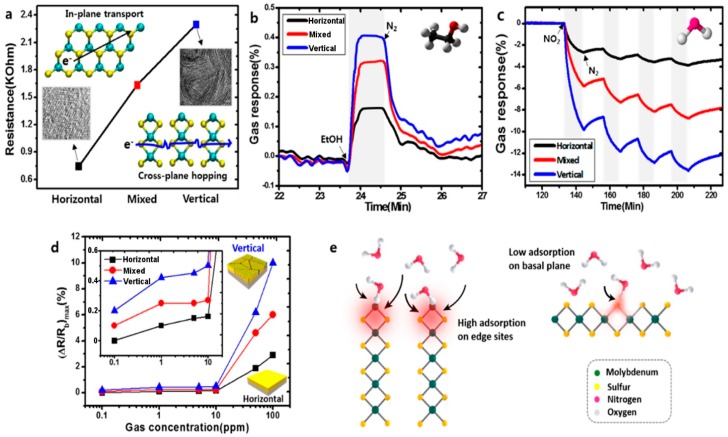
Figure 16.
Panel (a): vertically aligned MoS2 flakes have higher resistance due to cross-plane hopping of the carriers; Panel (b): resistance change to 1000 ppm of ethanol for horizontally (black curve), vertically (blue curve) and mixed aligned MoS2 flakes; Panel (c): resistance change to 100 ppm of NO2 for horizontally (black curve), vertically (blue curve) and mixed aligned MoS2 flakes; Panel (d): relative resistance change of the horizontally, vertically and mixed aligned MoS2 flakes to 0.1–100 ppm NO2; Panel (e): schematic representation of the adsorption of NO2 molecules on edge sites and basal plane of the MoS2 flakes. (Reproduced with permission from [173]. Copyright 2015 American Chemical Society, Washington, DC, USA).

