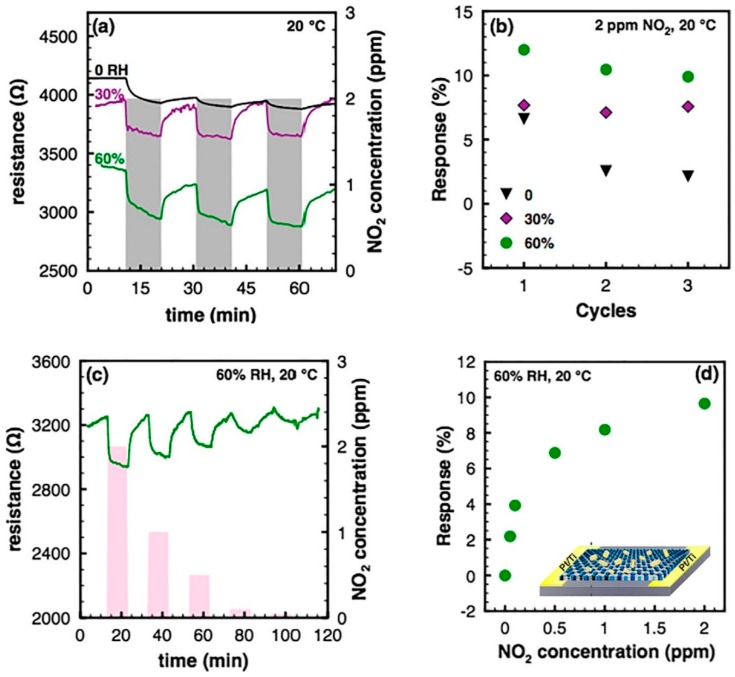
Figure 20.
Panel (a): resistance change of the WS2/GA sensor to cyclic exposure to NO2, at different RH values; Panel (b): NO2 response of the device at different RH values; Panel (c): electrical response of the WS2/GA device to different concentrations of NO2 at RH = 60%; Panel (d): calibration curve of the device exposed to NO2 at RH = 60%. Inset: sketch of the resistive WS2/GA device. (Adapted and reprinted from [196], with permission from Elsevier, Amsterdam, The Netherlands).

