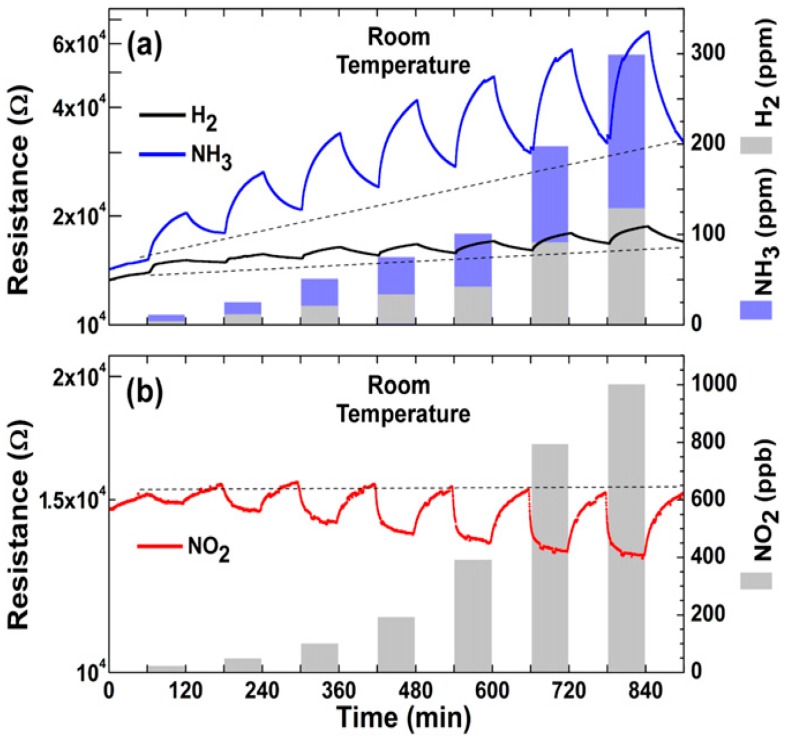
Figure 23.
Panel (a): RT sensing responses of exfoliated BP flakes to H2 (black curve) and NH3 (blue curve); Panel (b): RT sensing responses of exfoliated BP flakes to NO2. (Reproduced with permission from [212], © IOP Publishing, Bristol, United Kingdom. Reproduced with all permission. All rights reserved).

