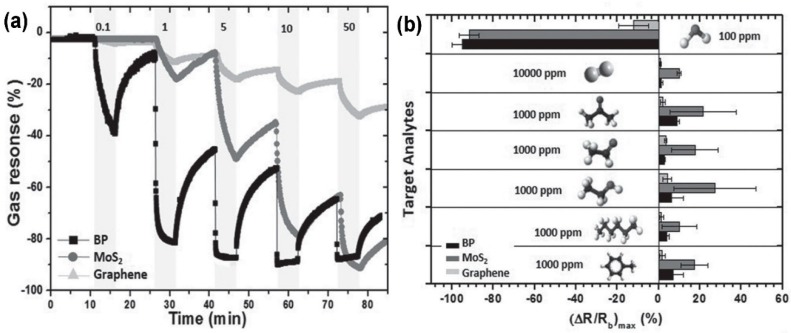
Figure 24.
Panel (a): resistance variation of BP, MoS2 and graphene sensors exposed to 0.1, 1, 5, 10 and 50 ppm of NO2; Panel (b): the maximal resistance change onto various analytes of BP, MoS2 and graphene sensors. (Adapted and reprinted from [213], with permission from Wiley-VCH Verlag GmbH & Co. KGaA, Weinheim, Germany).

