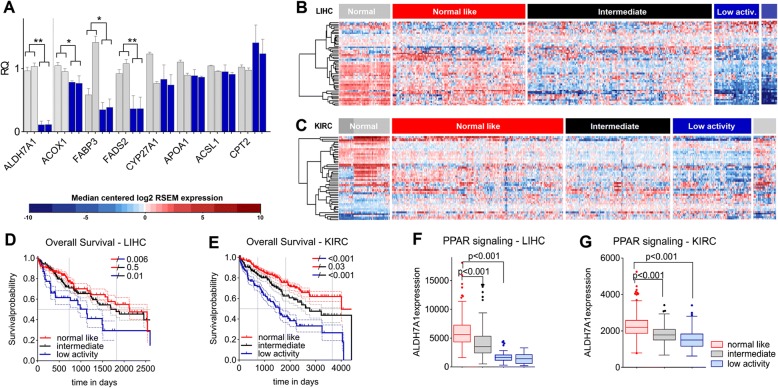
Fig. 5.
Correlation between PPAR signaling, ALDH7A1 levels and patient survival in LIHC and KIRC. a qPCR of PPAR transcriptional targets. Light grey – control BJ cells transduced with the empty vector and non-targeting shRNA, accordingly. Blue – ALDH7A1-depleted cells transduced with two independent shRNAs (sh-1 and sh-2). Data represent average ± standard error of the mean (SEM) from 3 independent experiments normalized β-ACTIN, KIF and TBP. The two-tailed Mann Whitney test with adjustment for False Discovery Rate was used to calculate p-values. b-c Heatmaps of median centered log2 RSEM expression values of PPAR target genes (selected from KEGG, version 6/3/16) for LIHC (b) and KIRC (c) data sets. Hierarchical clustering (Wards.D) was applied. X-axis patients, y-axis genes. Red – higher, blue – lower then median expression. d-e Overall survival analysis for patients divided into three groups based on the clustering analysis: normal-like (red), intermediate (black) and low PPAR activity (blue). Kaplan-Meier survival curves were plotted and Cox proportion hazards regression models were used to calculate p-values between groups. f-g Expression of ALDH7A1 mRNA levels in the patient groups defined as normal-like (red), intermediate (black) and low PPAR activity (blue). Boxplots indicate the mean RSEM value, upper and lower quartile. The two-tailed Mann Whitney test was used to calculate p-values

