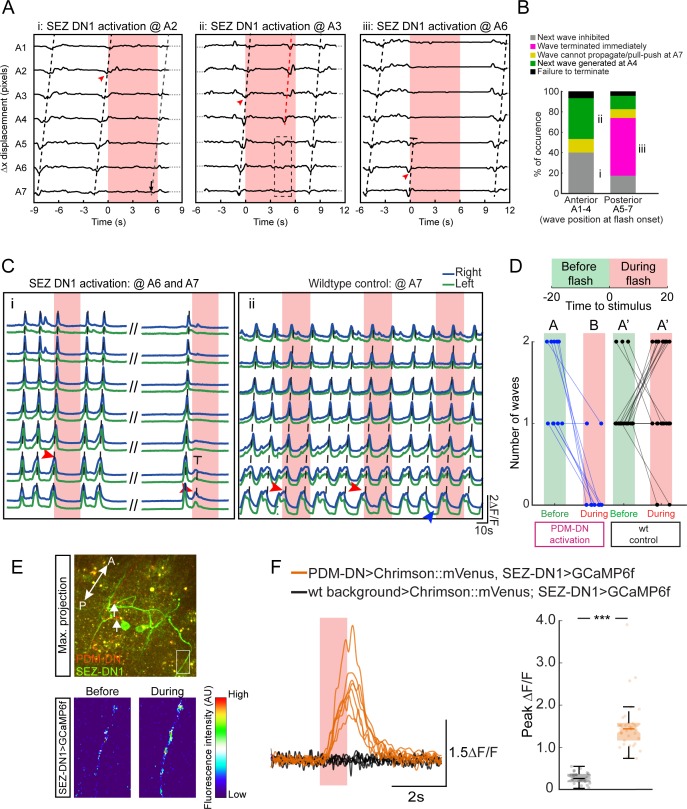
Figure 6. Detailed analysis of the gain-of-function phenotype of the SEZ-DN1 neuron at the level of segmental contractions and motor neuron activity.
Activation of SEZ-DN1 inhibits the forward wave propagation at the posterior segments of the VNC. (A) Decomposition of the SEZ-DN1 activation phenotype at the level of segmental contractions using immobilized larvae. The analysis results from the same protocol as Figure 4D. SEZ-DN1 was optogenetically activated when forward wave was at A2 (left), A3 (middle) or A6 (right). (Ai) When SEZ-DN1 activation coincided with wave propagation at A2 (red arrowhead), the current wave was likely to terminate but the initiation of a new wave was blocked for the duration of the light flash. (Aii) Occasionally a forward wave was initiated from segment A4 to segment A1 during the optogenetic activation of SEZ-DN1 (red dashed line, middle panel). However, no contractile activity was observed at the level of the posterior segments (dashed rectangle). (Aiii) SEZ-DN1 activation ceased ongoing forward wave immediately at the posterior segments. In this example, activation of SEZ-DN1 when the wave was at segment A6 (red arrowhead) led to an immediate termination of the wave (truncated dashed line). (B) Main effects of SEZ-DN1 activation on the propagation of the peristaltic wave reported as proportions. If SEZ-DN1 was activated when the forward wave was at the posterior segments, the wave often terminated immediately (magenta, see also panel Aiii). In ~20% of the cases, the next wave was inhibited during SEZ-DN1 activation (gray). Occasionally, a new forward wave started at A4 (green). We also observed a pull-push behavior in which the posterior segments engage in a loop of contraction-relaxation without wave propagating to more anterior segments (yellow, data not shown). Activation of SEZ-DN1 when the wave had reached the anterior segments led to a suppression of the initiation of new waves in ~40% of the cases (gray). Forward waves initiated at A4 were observed more frequently upon optogenetic activation of SEZ-DN1 when the ongoing wave was located in the anterior segments (~40%, green). For both the anterior and posterior segments, a small proportion of the optogenetic gain-of-function failed to affect the forward wave propagation (black). (C) Imaging of fictive locomotion patterns upon SEZ DN1 activation. Same protocol as Figure 4G (Ci) SEZ-DN1 optogenetic activation when the fictive wave was at A6 (first flash, red arrowhead) or at A7 (second flash, red arrowhead). Following the first flash, the ongoing wave terminated and a new wave could not be initiated during the duration of the flash. In subsequent flashes, the motor neuron activity was suppressed immediately at A6-7 and the wave stopped before reaching A5 (truncated dashed line). The entire course between the two flashes is not shown for clarity (dashes). (Cii) A wild-type control larva was exposed to the same flashes of light as the SEZ-DN1 >Chrimson. The light flashes had no impairing effects on forward wave initiation/propagation such that new forward waves could be initiated and completed during the light flashes. (D) Quantification of the effect of SEZ-DN1 activation on fictive forward locomotion. Same data-quantification protocol as Figure 4H. Optogenetic activation of the SEZ-DN1 neuron led to a decrease in number of forward waves (Wilcoxon signed-rank test, p<0.05) while wild-type controls were not affected by light flashes (Wilcoxon signed-rank test, p<0.05). Sample sizes: n = 23 trials for wild-type controls and n = 10 trials for SEZ-DN1 activation. Different letters indicate statistically significant differences. (E–F) Calcium imaging of SEZ-DN1 activity upon optogenetic activation of PDM-DN. (E-top panel) The approximate region of interest (ROI) for the quantification of SEZ-DN1 activity is highlighted with a rectangle. Axonal varicosities of PDM-DN (red) are faintly visible (arrows). A: anterior, P: posterior. (E-Bottom panel) Pseudo-colored illustration of the pattern of activity in the ROI shown in the top panel, before (left) and during PDM-DN activation (right). (F) Quantification of the SEZ-DN1 activity upon PDM-DN activation. (Left panel) Each CNS preparation was exposed to the same light-flash protocol five times. Quantification of the mean ∆F/F for each preparation. Upon PDM-DN activation (semitransparent red box), SEZ-DN1 activity increased drastically (orange). By contrast, SEZ-DN1 did not respond to the light flashes in the absence of CsChrimson::mVenus in the PDM-DN neuron (black). (Right panel) Boxplot of the peak responses measured on each trial. PDM-DN activation led to significant increase in the activity of SEZ-DN1 (Wilcoxon ranksum test). The line centered on the ‘waist’ represent the median of each experimental condition. Semi-transparent boxes represent the 25th and 75th percentiles. The whiskers extend to the most extreme data points excluding the outliers (default settings of the ‘boxplot’ function of Matlab). Starts indicate statistically a significant difference (***p<0.001). Sample sizes: n = 25 trials (five preparations) for SEZ-DN1 in the absence of PDM-DN activation and n = 35 trials (seven preparations) in the presence of PDM-DN activation. For more information about the statistics, see Supplementary file 1.

