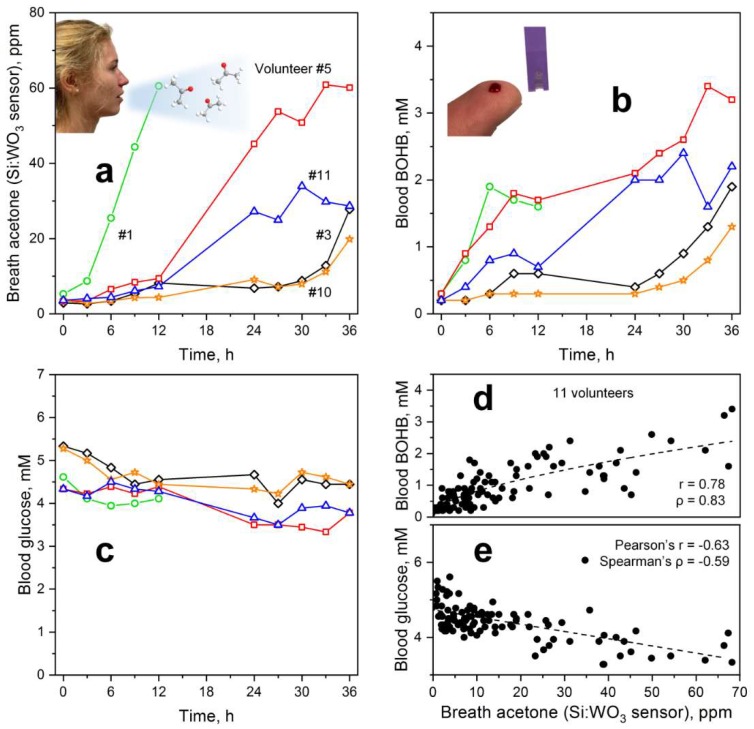
Figure 3.
Individual (a) breath acetone levels as determined by the Si-doped WO3 sensor, capillary blood (b) BOHB and (c) glucose concentrations of five representative volunteers during a 36-h KD. Note that volunteer #1 (green circles) had to abort the experiment already after 24 h due to strong nausea. Scatter plot of (d) BOHB and (e) glucose versus acetone concentrations for all eleven volunteers (105 samples) with corresponding Pearson’s (r) and Spearman’s (ρ) correlation coefficients. Dashed lines indicate fitted (power law in d and linear in e) trend lines.

