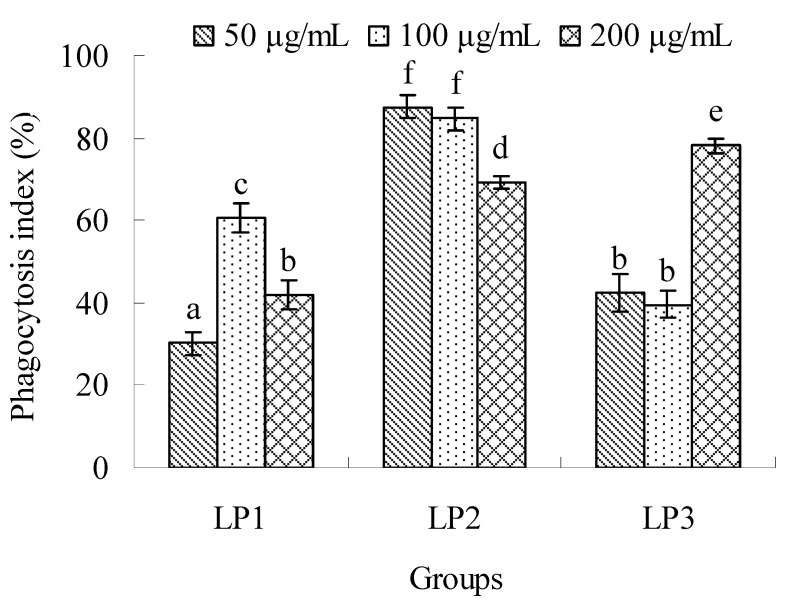
Figure 7.
Effects of LP1-3 on the phagocytosis of macrophages. The activity was evaluated by the phagocytosis index of neutral red and expressed as means ± SD (n = 3). The statistically significant differences among the groups were evaluated with ANOVA followed by the S-N-K test. Different letters in the figure represent the statistical difference at P < 0.05.

