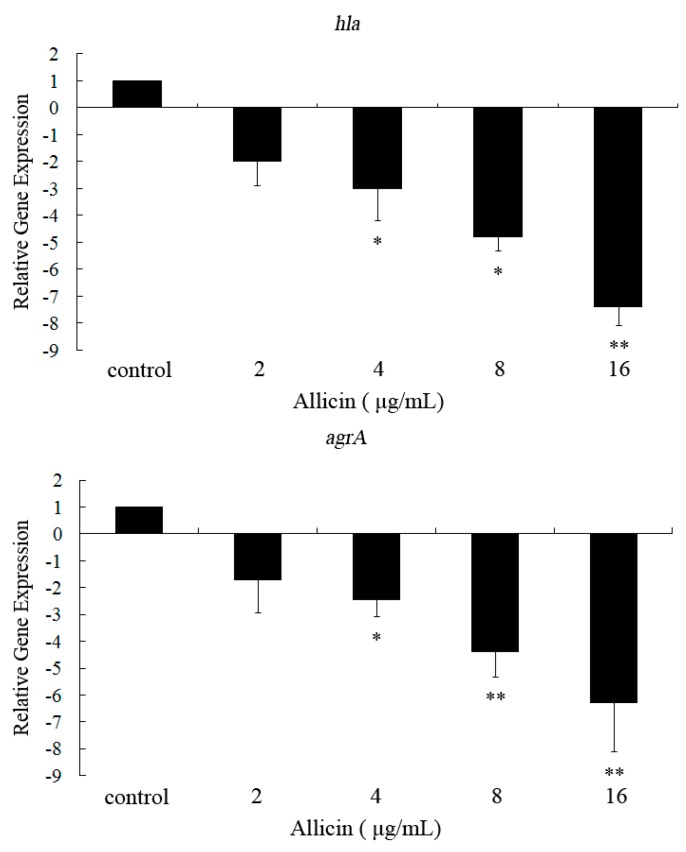
Figure 4.
Effectsof different concentrations of allicin on the transcription of hla and agrA in S. aureus. Data are expressed as the means ± SD for three independent experiments. The Student’s t-test was used to determine statistical differences. * Indicates p < 0.05 and ** indicates p < 0.01 vs. control.

