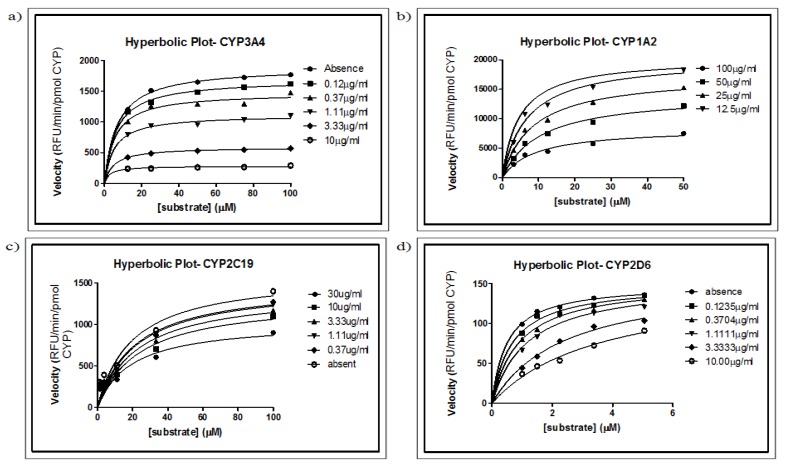
Figure 2.
Ki determination using the non-linear regression method. Direct plot reaction velocity against different concentrations of substrate in the absence or presence of different concentrations of Mitragyna speciosa extract. Increasing the M. speciosa extract concentration resulted in reduced apparent Vmax and increased apparent Km for CYP3A4, CYP1A2 and CYP2C19. For CYP2D6, Vmax remained constant but the Km value was increased (not shown).

