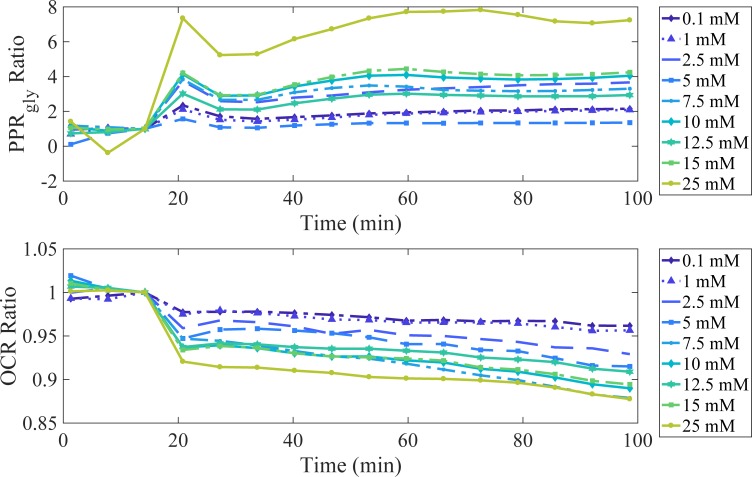
Fig 2. The effect of extracellular glucose on PPRgly and OCR.
HepG2 cells were exposed to serial concentrations of glucose (0.1 to 25 mM) at t = 16 minutes. PPRgly and OCR values are normalised by the values obtained prior to glucose exposure and are expressed as the PPRgly and OCR ratios compared to zero glucose added. Measurements are an average of n = 4 experimental repeats.

