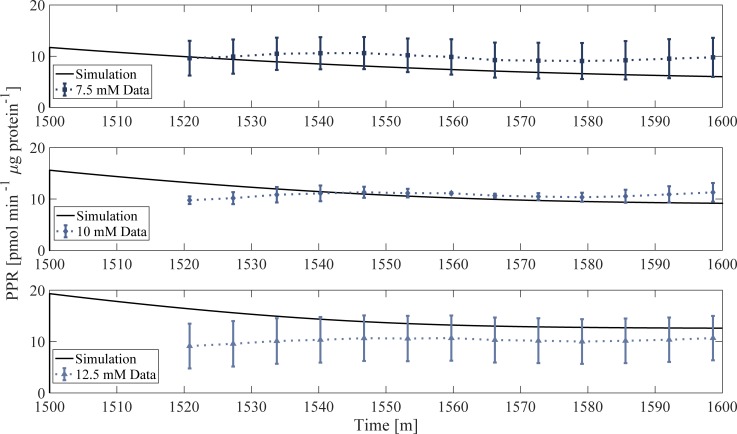
Fig 6. Model validation.
Model simulation of PPRgly (solid line) compared to in vitro PPRgly data normalized to protein content. PPRgly data was taken from EFA results (Fig 2) followed by adjusting each ECAR measurement for respiratory contributions. Prior to t = 1440 min, the model is simulated to steady state with extracellular glucose concentration of 25 mM (not shown). At t = 1440 min, extracellular glucose and lactate is removed to replicate in vitro procedure. At t = 1500 min, glucose is reintroduced at 5 mM allowing comparison to experimental data.

