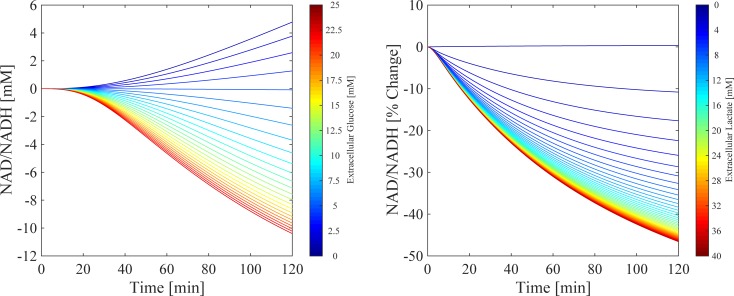
Fig 8. Extracellular substrate perturbations.
Simulations of the resulting changes in NAD+/NADH ratio as a function of perturbations in extracellular glucose (A, 0 to 25mM) and lactate (B, 0 to 40 mM). Each simulation represents the percentage change in NAD+/NADH compared to an unperturbed simulation (black dashed line) over a 120-min period, with the perturbation of extracellular substrate occurring at 0 min. Time therefore represents time post-perturbation.

