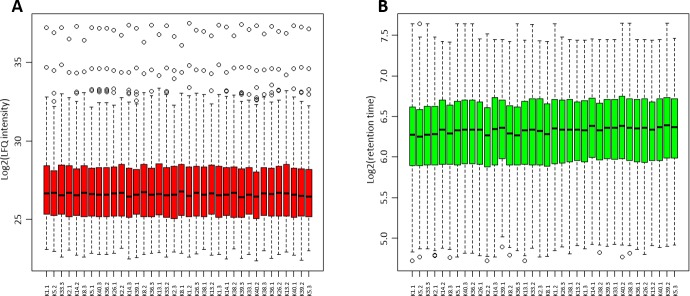
Fig 1. Box plots of LFQ intensities and peptide retention times.
Log2 of the LFQ intensities of all proteins, which were quantified in 100% of the samples, are shown in A (red box plots). The data were not further normalized or transformed once the values from MaxQuant were obtained. B shows the log2 of peptide retention times for every LC-MS/MS run (green box plots).

