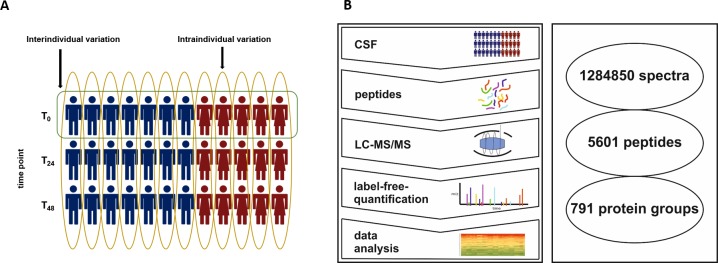
Fig 2. Study overview.
A: Two variables, time point (T0, T24 and T48) and human subject (red figures represent female subjects, and blue figures represent male subjects), can characterize every sample in this study, and for every human subject, three samples were obtained. In this study, the inter- and intraindividual variability of the CSF were analyzed. Hereby, the intraindividual variability is defined as the variation within one human subject between the three time points (yellow circle), and the interindividual variability is defined as the variation between all subjects at T0 (green circle). B: The workflow included CSF sampling, sample preparation, tryptic digestion, LC-MS/MS with LFQ and data analysis. We identified 1,284,850 spectra, which resulted in 5601 peptides and 791 protein groups.

