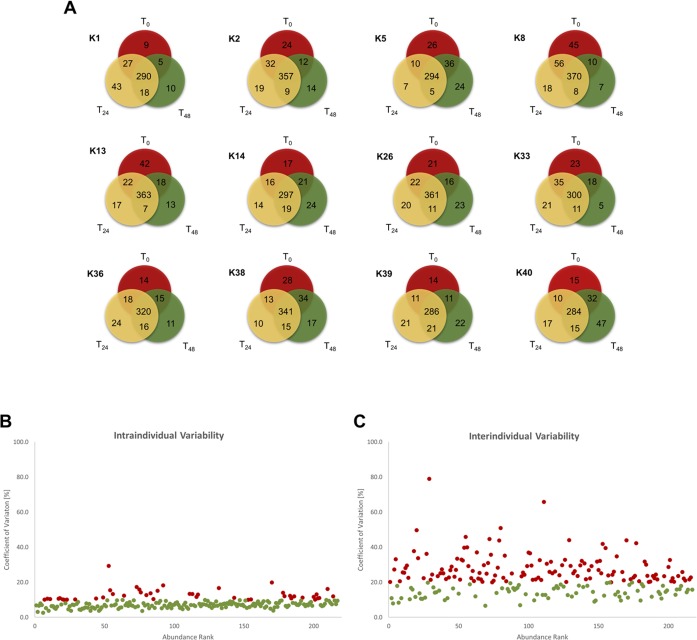
Fig 3. Intra- and interindividual variability.
A: This figure provides twelve Venn diagrams, one for each human subject. Only proteins that were found with at least 2 unique peptides in one of three samples were counted. The three time points are represented by different colors. Proteins that were identified in all three samples are shown in the middle overlap. Each overlap between two circles gives the number of proteins that were identified in these two samples. B: CVt values were calculated for all 216 proteins of the CSF core proteome and were plotted against their abundance rank. Proteins with CVt > 10% are colored in red, and those with CVt < 10% are colored green. C: CVg values were calculated for all 216 proteins of the CSF core proteome and were plotted against their abundance rank. Proteins with CVg > 20% are colored red, and those with CVg < 20% are colored green.

