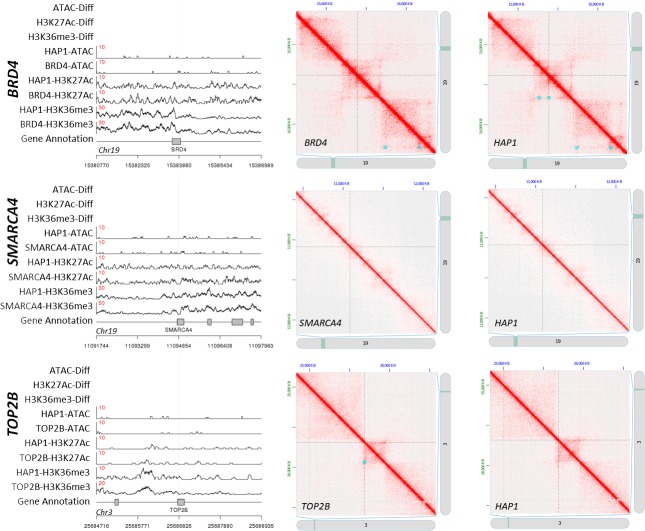
Fig 3. Structural impact of CRISPR/Cas9-targeted mutations in human cell lines.
Left three images: Read depth (y-axis) is shown as a function of genomic position (x-axis) for representative ATAC-Seq, H3K27Ac ChIP-Seq, and H3K36me3 ChIP-Seq data for the specified HAP1 cell line at the location of the targeted CRISPR/Cas9 deletions (i.e., HAP1-ATAC is ATAC-Seq sequencing read depth for the HAP1 parent strain). The red number on each trace designates the scale for that trace. Vertical blue lines designate the deletion site. Differentially accessible or occupied regions are marked with red boxes in the top three rows labeled “-Diff". No differential peaks were observed for these deletions. Right six images: Hi-C contact maps show which regions of the genome are proximal to each other. Darker red regions exhibit relatively higher levels of association. Contact maps are shown for the same region in the CRISPR/Cas9 modified strain (left) and the unmodified parent strain (right). The location of the primary deletion is at the intersection of the two dashed lines. Blue boxes designate called loops for each data set. Loops are only marked on one half of the contact map to allow visualization of the corresponding region on the other half.

