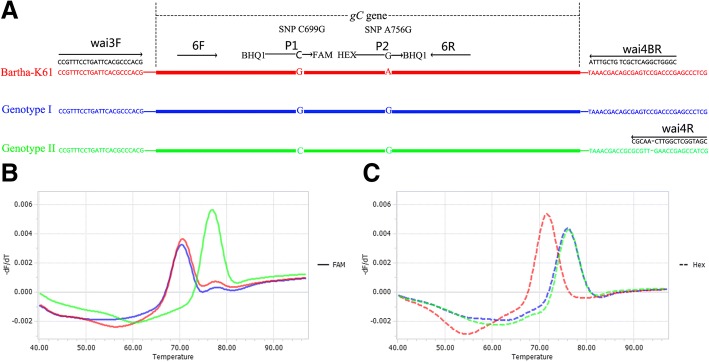
Fig. 1.
Schematic illustration of the duplex FMCA method. (a) Relative binding positions of primers and probes along the gC gene of PRV. Melting peak calculation by derivative plotting -dF/dT versus temperature in the FAM channel (b) and the HEX channel (c). Red, blue, and green lines represent Bartha-K61 vaccine, European/American (Genotype I), and Chinese (Genotype II) strains, respectively

