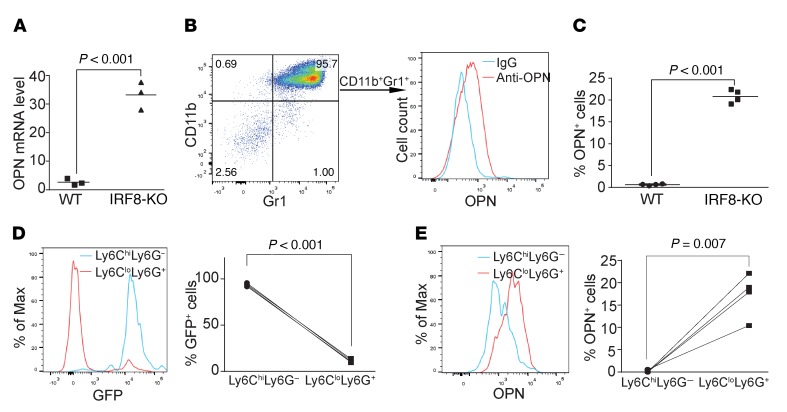
Figure 3. IRF8 represses the expression of OPN expression in myeloid cells.
(A) RNA was prepared from total spleens of WT (n = 3) and IRF8-KO (n = 3) mice and analyzed by qPCR for OPN mRNA level. (B) Spleen cells of WT (n = 3) and IRF8-KO (n = 3) mice were stained with CD19-, CD3-, CD11b-, and Gr1-specific mAbs, followed by intracellular staining of OPN. The OPN+ cells were gated to show the CD11b+Gr1+ myeloid cells from IRF8-KO mice (left panel). OPN protein level in these CD11b+Gr1+ myeloid cells is shown in the right panel. (C) The OPN+ cells in total spleen cells of WT (n = 3) and IRF8-KO (n = 3) mice as shown in B were quantified. (D) Spleen cells from IRF8-GFP mice were stained with Ly6G- and Ly6C-specific mAbs. Ly6ChiLy6G+ and Ly6CloLy6G– cells were overlaid for GFP intensity. Shown are representative plots of 1 of 3 mice (left panel). The GFP+ cells of the Ly6ChiLy6G+ and Ly6CloLy6G– cells were quantified and are presented in the right panel. (E) The spleen cells were stained with Ly6C- and Ly6G-specific mAbs, followed by intracellular staining with OPN-specific antibody. The Ly6ChiLy6G+ and Ly6CloLy6G– cells were gated and analyzed for OPN expression level. Representative plot of 1 of 3 mice is shown. The OPN+ cells in Ly6ChiLy6G+ and Ly6CloLy6G– cells were quantified and are presented in the right panel.

