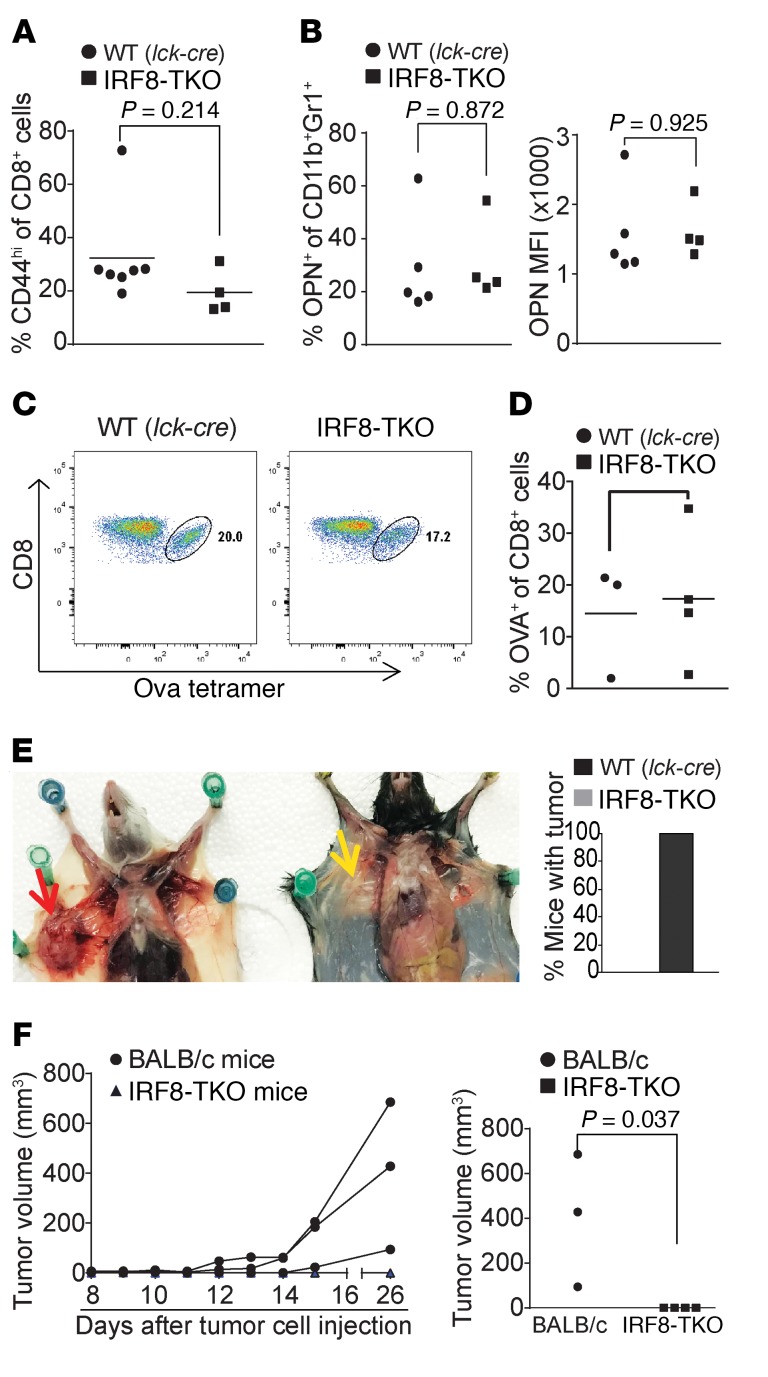
Figure 6. Mice with IRF8 deficiency only in T cells exhibit no deficiency in generation of antigen-specific CD8+ T cells and reject allograft tumor.
(A) Blood cells were collected from WT (Lck-cre+/–Irf8+/+, n = 7) and IRF8-TKO (n = 4) mice. Cells were stained with CD8- and CD44-specific mAbs and analyzed by flow cytometry. The CD8+ and CD44hi cells were quantified. Column: mean; bar: SD. (B) Spleen cells were collected from WT (Lck-cre+/–Irf8+/+, n = 7) and IRF8-TKO (n = 4) stained with CD11b- and Gr1-specific mAbs, followed by intracellular staining with OPN-specific mAb. The CD11b+Gr1+ cells were then gated and analyzed for percentage of OPN+ cells (left panel) and OPN MFI (right panel). (C) WT (Lck-cre+/–Irf8+/+, n = 4) and IRF8-TKO (n = 3) mice vaccinated with OVA peptide, followed by a boost with OVA peptide 14 days later. Peripheral blood was collected 7 days after boost and stained with MHCII-, CD8-, and OVA tetramer–specific antibodies. MHCII-CD8+ cells were gated for OVA tetramer+ cells. Shown are representative plots of OVA-specific CD8+ T cells in WT and IRF8-TKO mice. (D) WT and IRF8-KO CD8+ OVA-specific T cells as shown in C were quantified. (E) 4T1 cells (1 × 10⁴ cells/mouse) were injected into the mammary gland of BALB/c (n = 3) and IRF8-TKO (C57BL/6, n = 4) mice. Mice were sacrificed at day 26 and dissected for examination of tumor presence. Shown is a representative image of 4T1 tumor-bearing BALB/c and 4T1 tumor-challenged IRF8-TKO mice. The red arrow indicates location of the 4T1 tumor. Yellow area indicates lack of tumor in injected area. The right panel shows percentage of mice with tumor. (F) Tumor growth was monitored over time and the tumor growth kinetics is presented in the left panel. Each line represents the tumor growth kinetics of an individual mouse. The tumor size at day 31 after tumor injection is presented in the right panel.

