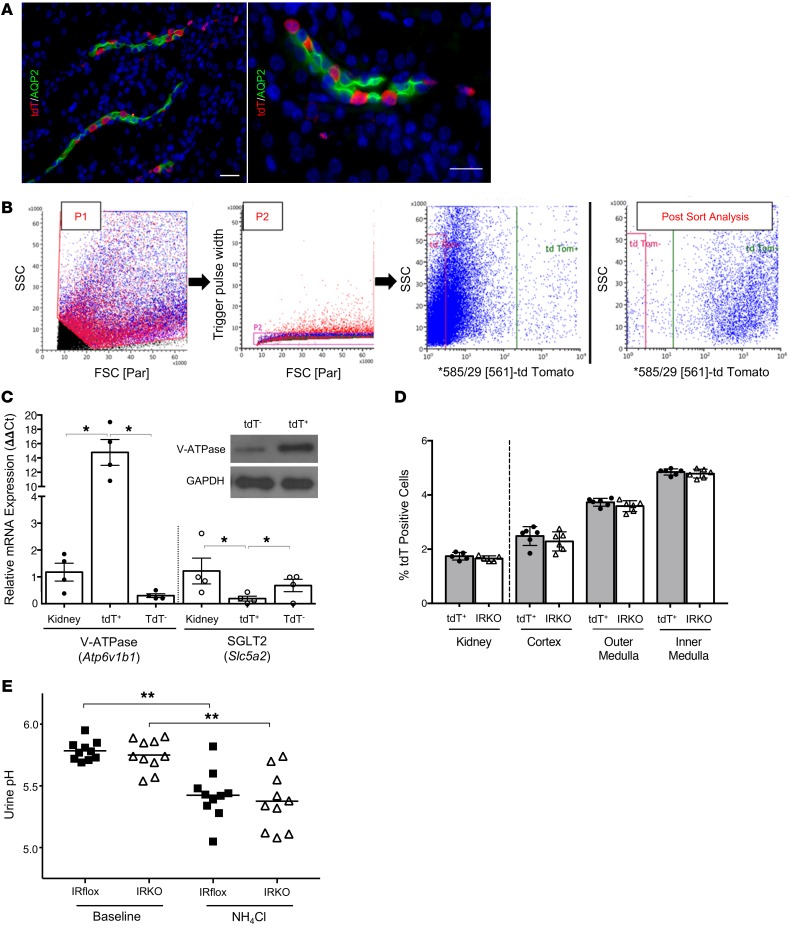
Figure 4. IR deletion in the kidney’s ICs does not impact IC numbers or urine acidification.
(A) V-ATPase-Cre+ tdT+/+ mouse kidney labeled for aquaporin-2–positive principal cells (green), tdT+ ICs (red), and nuclei (blue). Original magnification, ×20 (left) and ×63 (right). Scale bars = 25 μm. (B) Representative FACS plots used to enrich tdT+ ICs with a sequential gating protocol. First, whole cells were gated (P1) and debris was excluded. From this population, only single cells were selected for further sorting by gating with the Trigger Pulse Width (P2). Single cells were then sorted by tdT expression. Rightmost plot is tdT+ postsort analysis showing enrichment from less than 2% in total kidney to greater than 90% after FACS. (C) Transcript expression of Atp6v1b1 and Slc5a2 in digested kidney, FACS-isolated tdT+ ICs, and FACS-isolated tdT– cells (n = 4 mice). Atp6v1b1 encodes the IC-specific β1 subunit of the V-ATPase hydrogen pump and Slc5a2 encodes the proximal tubule glucose transporter Sglt2. Asterisks denote significant P values for the pairwise comparisons (Kruskal-Wallis). Western blot confirms V-ATPase β1-subunit enrichment in tdT+ ICs (inset). (D) IC numbers in V-ATPase-Cre+ tdT+/+ (labeled tdT+) and IRKO kidneys enumerated by FACS (left of dashed line) and automated microscopic counting (right of dashed line). Graphs show the mean and SEM (n = 5–6 mice/genotype). (E) Ammonium chloride loading of IRflox and IRKO mice. Urine pH before (baseline) and after acid loading (NH4Cl). The horizontal line indicates the mean of each group. Asterisks indicate significant P values for the indicated pairwise comparison as determined by the paired 1-way ANOVA with Tukey’s test. *P < 0.05, **P < 0.01.

