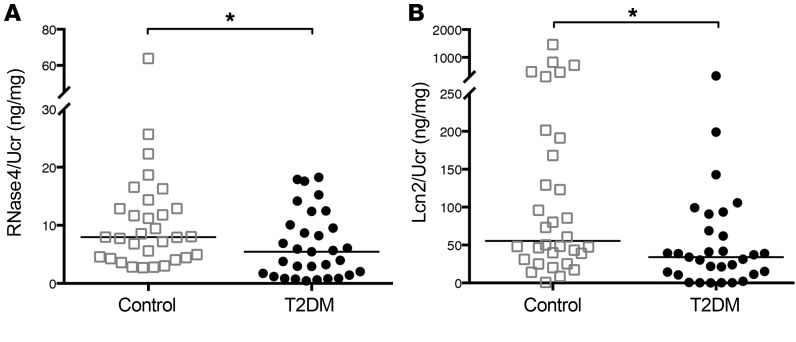
Figure 7. Urinary RNase4 and Lcn2 concentrations are suppressed in youth with type 2 diabetes.
(A) Urinary RNase4 and (B) Lcn2 concentrations, standardized to UCr, in healthy (n = 31) and T2DM children/adolescents (n = 31). Horizontal bars represent median urinary AMP/UCr concentrations. Asterisks denote significant P values for the indicated pairwise comparisons (Mann-Whitney U test). *P < 0.05.

