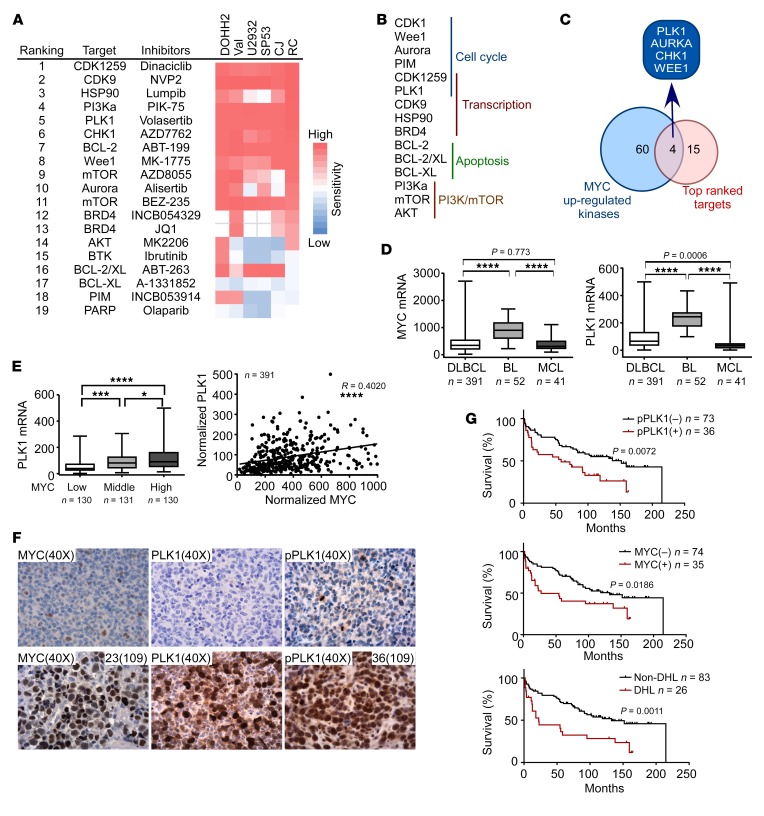
Figure 2. PLK1 is elevated in DHL, connotes poor survival, and is a therapeutic vulnerability for DHL cells.
(A) Functional drug screens in DHL cells (DOHH2, Val, U2932, SP53, CJ, and RC); summary of top 19 ranked small molecules and corresponding targets, as represented in an IC50 heatmap format. (B) Top ranked small-molecule inhibitors of DHL are categorized according to their target signaling pathways. (C) Overlap of MYC-upregulated kinases by ABPP (see Figure 1E) and top ranked small-molecule inhibitors having activity versus DHL. (D) MYC and PLK1 mRNA levels were analyzed in a gene expression profiling data set of DLBCL, BL, and mantle cell lymphoma (MCL). ****P < 0.0001. (E) Correlation of the mRNA levels of MYC and PLK1 in DLBCL. *P = 0.0406; ***P = 0.0005; ****P < 0.0001. (F) Representative images of MYC, PLK1, and p-PLK1 IHC staining in reactive lymphoma nodes (top panels) versus DHL (bottom panels). Original magnification, ×40. (G) Clinical outcome of 109 cases of DLBCL patients treated with R-CHOP when correlated with p-PLK1 and MYC expression and DHL classification. Comparisons among group means in D and E were performed by 1-way ANOVA, followed by Tukey’s test for multiple-comparison test.

