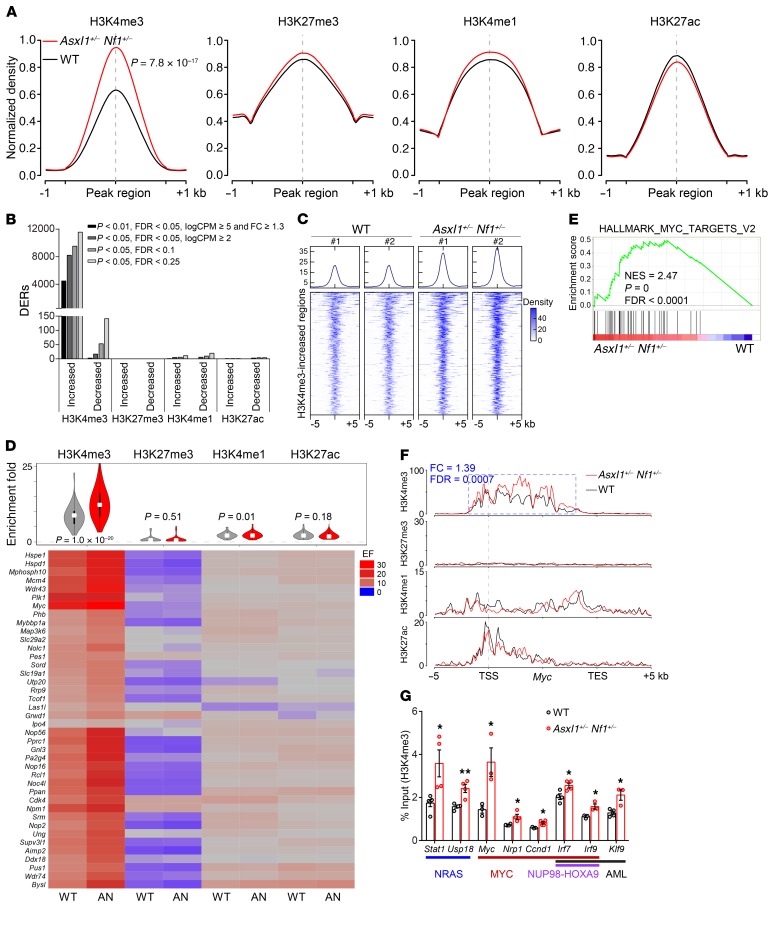
Figure 4. Increased H3K4me3 enrichment contributes to aberrant activation of key signatures in Asxl1+/– Nf1+/– cKit+ cells.
(A) Global levels of histone modifications at peaks and flanking 1-kb regions. For ease of comparison, normalized coverages by sequencing depth were scaled to 100% and averaged in 2 biological replicates. (B) Number of DERs for each histone modification identified in Asxl1+/– Nf1+/– cells compared with WT cells according to different cutoffs. (C) Density plot of H3K4me3 ChIP-Seq data sets centered on the midpoints of 610 H3K4me3-increased regions. The plot depicts tag counts in 50-bp bins in the ± 5-kb region surrounding the center. Each row represents a single region. (D) Heatmap displays the densities of histone modification marks on 40 activated genes from the hallmark MYC signature. The ChIP signal density was calculated to be enrichment fold (EF) for the TSS ± 5-kb regions that were averaged in 2 biological replicates. AN, Asxl1+/– Nf1+/–. (E) GSEA plot showing enrichment of the hallmark MYC signature consisting of 40 activated genes in genes marked by promoter H3K4me3 occupancies in Asxl1+/– Nf1+/– versus WT cells. NES, P, and FDR values are shown. (F) Normalized ChIP-binding signals are displayed for 4 histone modifications on the Myc gene. The y axis represents the normalized read density that was averaged in 2 biological replicates. The identified DER and its statistical difference between Asxl1+/– Nf1+/– versus WT cells are indicated in a blue box. TES, transcription end site. (G) ChIP-qPCR verified the increase in H3K4me3 occupancies at the promoters of the indicated genes associated with NRAS, MYC, NUP98-HOXA9, and AML (n = 3–4 mice per group). Data represent the mean ± SEM. *P < 0.05 and **P < 0.01, by unpaired Student’s t test.

