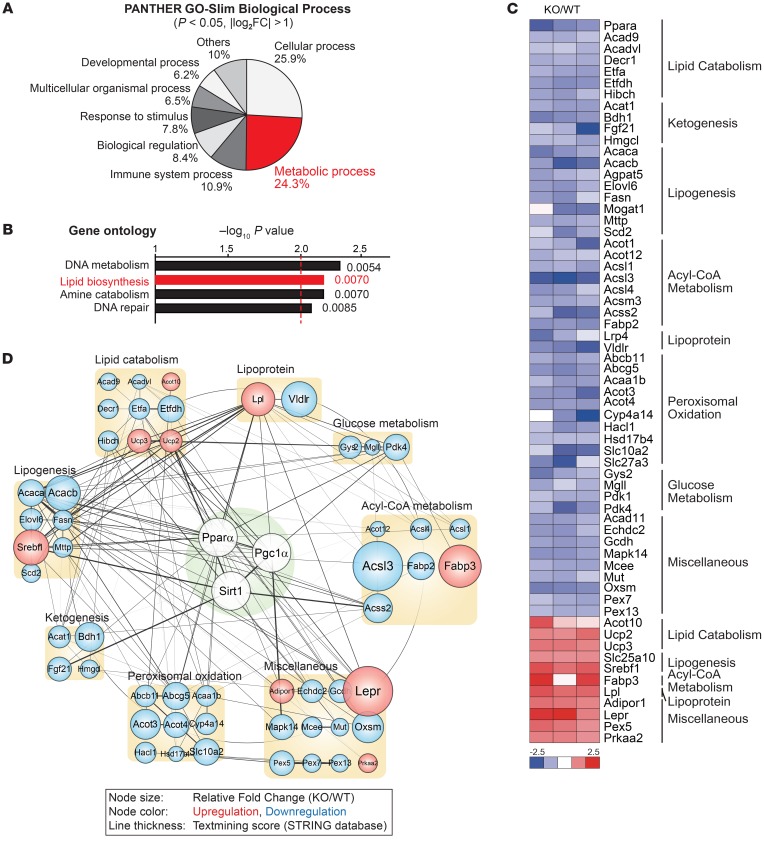
Figure 2. Gα12 regulation of mitochondrial respiration via SIRT1/PPARα network.
(A) PANTHER pathway analysis in the cDNA microarrays performed using RNA samples extracted from the livers of 8-week-old male WT or Gna12-KO mice that had been fasted overnight before sacrifice (n = 3/group). Percentage of number of genes that belong to respective pathway categories over total number of genes analyzed is shown. (B) GO analysis of major signaling pathways in cDNA microarrays using the DAVID bioinformatics database. (C) Heatmap of the genes associated with energy metabolism in the same cDNA microarrays used for A. The log2 ratios of Gna12-KO/WT were presented using heatmap (blue, underexpression; red, overexpression). (D) Core network analysis associated with the SIRT1/PPARα pathway. PPARα-associated genes affected by Gna12 KO are represented as colored circles and assigned to specific subcategories. Genes upregulated (red circles) or downregulated (blue circles) in the microarrays are shown for each subcategory. Line thickness represents the strength of evidence provided by the STRING database.

