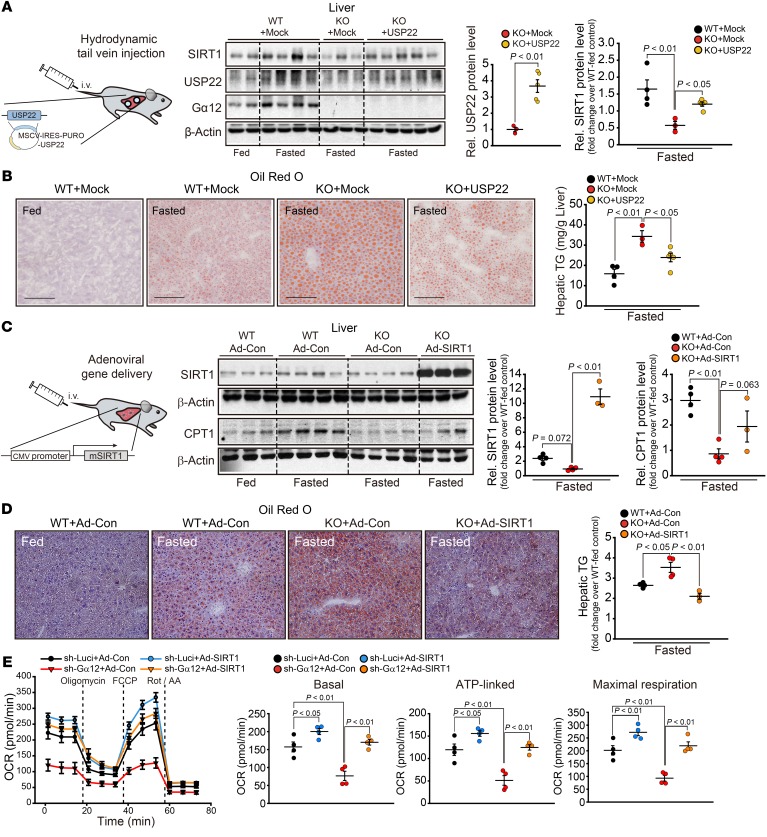
Figure 6. Rescue of metabolic phenotype of Gna12 KO by overexpression of USP22 or SIRT1.
(A) Effect of hepatic USP22 overexpression on SIRT1 induction by fasting. Immunoblotting for SIRT1 and USP22 (center) in the liver homogenates and SIRT1 quantification (far right). WT and Gna12-KO mice at 12 weeks of age were hydrodynamically injected with the plasmid expressing USP22 or control vector (Mock) (n = 3–5/group) (left). Third panel shows densitometric analysis for USP22 in the liver (n = 3–5/group). (B) Representative oil red O staining (left) and hepatic TG contents (right) (n = 3–5/group). Scale bars: 100 μm. (C) Effect of hepatic SIRT1 overexpression on CPT1 induction by fasting. Immunoblotting for SIRT1 and CPT1 (center) in the liver homogenates and their respective quantifications (right) (n = 3–4/group). WT and Gna12-KO mice at 15 weeks of age were injected with the adenovirus carrying mouse SIRT1 (Ad-SIRT1, 2.8 × 10⁹ PFU/mouse) or GFP control (Ad-Con)via the tail vein (left). (D) Representative oil red O staining (left) and TG contents (right) in liver tissues (n = 3–4/group). Original magnification, ×20. (E) Effect of SIRT1 overexpression on OCR in AML12 cells. OCR was measured in AML12-sh-Gα12 (or AML12-sh-Luci) cells infected with Ad-SIRT1 (or Ad-Con) in the presence of oligomycin (1 μM), carbonyl cyanide 4-(trifluoromethoxy)phenylhydrazone (FCCP) (1 μM), or rotenone plus antimycin A (0.5 μM each). Results represent 4 independent experiments (n = 6–8 replicates/group for each experiment). Values represent mean ± SEM. Data were analyzed by 2-tailed Student’s t test (A, USP22) or ANOVA followed by LSD (A [SIRT1], C, and E) or Bonferroni’s (B and D) post hoc tests. For A–D, only fasted groups were analyzed for ease of data presentation. For A and C, blots in each panel were run in parallel using the same samples and β-actin was used as a normalization control for densitometric analysis.

