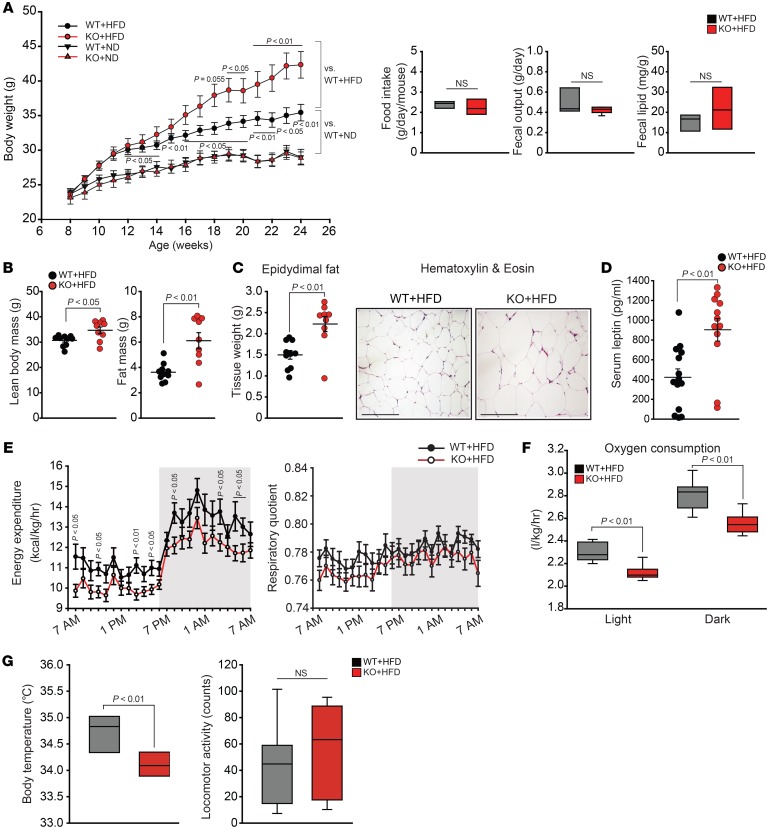
Figure 8. Changes in whole-body energy metabolism and adiposity by a deficiency of Gα12.
(A) Effect of Gna12 KO on body weight gains, food intake, fecal output, and fecal lipid content in mice fed HFD. Body weight (n = 8–14/group) and daily food intake (n = 9–10/group) of WT or Gna12-KO mice fed HFD were monitored once every week for 16 weeks. Fecal output and fecal lipid content were measured during the 13th week (n = 9–10/group). (B) Adiposity in Gna12-KO mice fed HFD. Fat mass was assessed by weighing total epididymal, mesenteric, inguinal, perirenal fat pads, and brown adipose tissue. Lean body mass was assessed by subtracting fat mass from total body mass (left, n = 9–10/group). (C) Epididymal fat pad weight (left, n = 9–10/group) and representative H&E staining (right, n = 3/group) of white adipose tissue from WT or Gna12-KO mice fed HFD for 16 weeks. Scale bars: 100 μm. (D) ELISA assays for serum leptin (n = 12–14/group). (E) Energy expenditure and respiratory quotient profiles. Metabolic profiles were measured in WT or Gna12-KO mice fed HFD for 4 weeks using comprehensive animal metabolic monitoring system (CLAMS) (n = 11–12/group). (F) Whole-body oxygen consumption. Oxygen consumption was measured in mice as described in E (n = 11–12/group). (G) Body temperature and locomotor activity. Resting rectal body temperature was measured in WT or Gna12-KO mice fed HFD for 12 weeks (left, n = 5–6/group). Locomotor activities were monitored using CLAMS in mice as described in E (right, n = 11–12/group). Values represent mean ± SEM. Data were analyzed by ANOVA followed by Bonferroni’s (A) post hoc test or 2-tailed Student’s t test (B–F). For A, F, and G, box-and-whisker plots show median (horizontal lines within boxes), 5%–95% percentile (ends of the boxes), and range of minimum to maximum values (whiskers).

