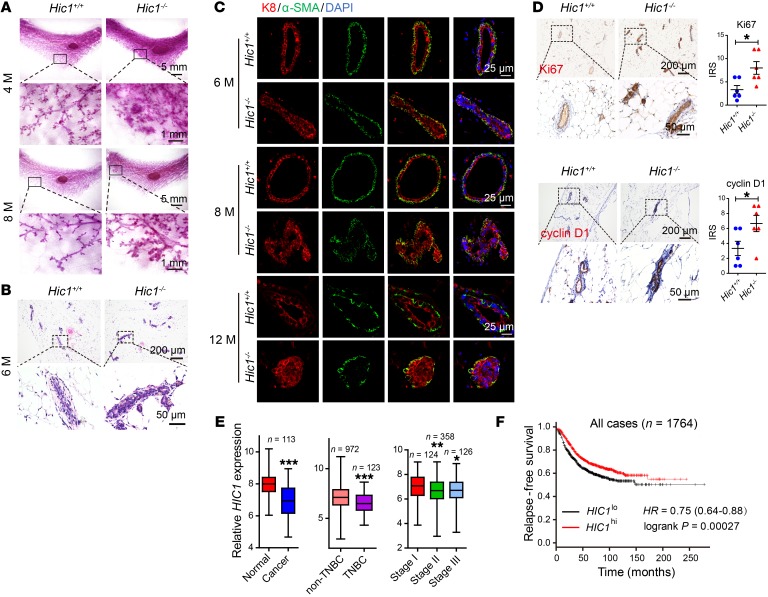
Figure 1. HIC1 deletion induces hyperplasia of mammary gland in vivo.
(A) Representative whole-mount staining of the fourth inguinal mammary glands at the indicated ages (4 months and 8 months) were prepared from Hic1+/+ mice or Hic1–/– mice and stained with carmine aluminum (n = 6 for each group). M, months. (B) H&E staining of the mammary glands of 6-month-old mice. (C) Immunofluorescence staining of luminal epithelial marker (K8) and myoepithelial markers (α-SMA) in the mammary glands of 6-month-old, 8-month-old, and 12-month-old mice. (D) Immunohistochemical staining of Ki67 and cyclin D1 in mammary glands of 6-month-old mice. The dot plots show the mean value for each immunoreactivity score (IRS) with statistical evaluation. Data are shown as mean ± SEM. n = 6. *P < 0.05, 2-tailed Student’s t test. (E) Box plots of HIC1 mRNA levels in paired normal breast/BrCa tissues (left, paired t tests), non-TNBC/TNBC tissues (middle, 2-tailed Student’s t tests), and BrCa tissues at different stages (right, 1-way ANOVA followed by Bonferroni’s post hoc test). Data were obtained from the TCGA data set (TCGA_BRCA_exp_HiSeqV2-2015-02-24). *P < 0.05; **P < 0.01; ***P < 0.001. (F) Kaplan-Meier plots of the relapse-free survival of patients with BrCa in whole data sets stratified by HIC1 expression. Data were acquired from the Kaplan-Meier plotter database. P = 0.00027, log-rank test (28). Representative images in this figure were obtained from at least 3 animals of each genotype.

