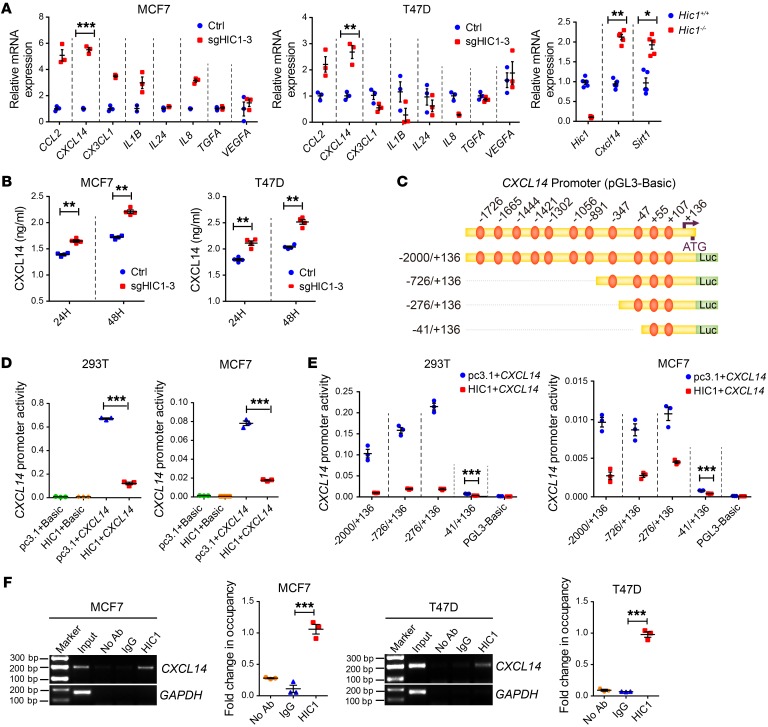
Figure 3. CXCL14 is a direct target gene of HIC1.
(A) Left: relative RT-qPCR analysis of 8 differentially expressed genes (CCL2, CXCL14, CX3CL1, IL1B, IL24, IL8, TGFA, and VEGFA) after HIC1 deletion in MCF7 and T47D cells (n = 3). Right: relative RT-qPCR analysis of Hic1, Cxcl14, and Sirt1 mRNA levels in the mammary glands of Hic1–/– or Hic1+/+ mice (n = 5). (B) ELISA analysis of CXCL14 levels in the CM of MCF7sgHIC1MCF7Ctrl and T47DsgHIC1T47DCtrl cells. The supernatants were collected after culture of the cells for 24 hours or 48 hours (n = 4). (C) Schematic of the CXCL14 promoter region. The positions of selected consensus binding sites are indicated above the diagram; the lengths of the promoter constructs used in the reporter assays are shown below. (D) CXCL14 promoter activity after transfection of the full-length construct (–2000/+136) alone or together with HIC1 expression vectors. p–GL3-Basic, control for promoter constructs; pc3.1, control for the HIC1 expression vector. The results are expressed as the ratio of firefly luciferase to Renilla luciferase (n = 3). (E) CXCL14 promoter activity after cotransfection with 100 ng of the HIC1 expression vector and each of the promoter constructs. The –41/+136 construct had a significant repressive effect, despite its lower promoter activity (n = 3). (F) ChIP analysis of HIC1 at the CXCL14 promoter region in MCF7 and T47D cells (n = 3). Data are shown as mean ± SEM. n = 3 independent experiments. *P < 0.05; **P < 0.01; ***P < 0.001, 2-tailed Student’s t tests (A, B, and E), 1-way ANOVA followed by Bonferroni’s post hoc test (D and F).

