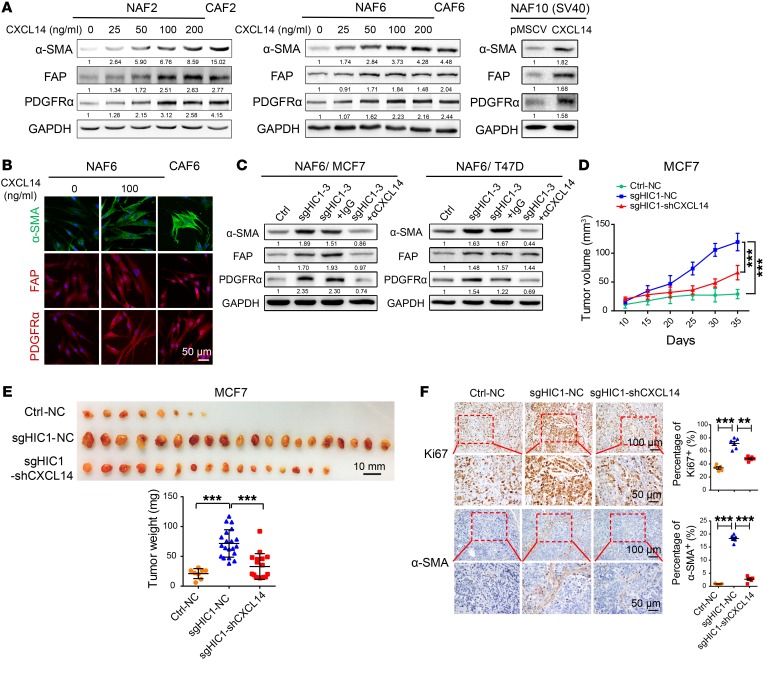
Figure 4. CXCL14 derived from HIC1-deleted BrCa cells mediates the activation of mammary fibroblasts.
(A) Left: NAF2 or NAF6 cells were treated with rhCXCL14 at various concentrations (0–200 ng/ml) for 4 days. The corresponding primary CAF2 or CAF6 cells were used as positive controls. Right: immortalized NAF10 cells stably overexpressed CXCL14. Cell lysates were analyzed by Western blot with antibodies against α-SMA, FAP, PDGFRα, and GAPDH. (B) Representative immunofluorescence staining detection of α-SMA, FAP, and PDGFRα expression in NAF6 or CAF6 cells treated similarly to the cells described in A. (C) NAF6 cells were cocultured with MCF7CtrlMCF7sgHIC1 or with T47DCtrlT47DsgHIC1 luminal BrCa cells for 4 days in the presence or absence of α-CXCL14 at 1 μg/ml or an isotype-matched IgG control. Cell lysates from NAF6 cells were analyzed by Western blot with antibodies against α-SMA, FAP, PDGFRα, and GAPDH. (D) Three MCF7 cell lines (Ctrl-NC, sgHIC1-NC, sgHIC1-shCXCL14) were injected bilaterally into the fourth mammary fat pads of female BALB/c nude mice (n = 10 per group). Tumor volumes were measured with calipers at the indicated time points. Data are shown as mean ± SD. ***P < 0.001, RM ANOVA followed by post hoc LSD test. (E) Photographs and weights of the tumors obtained from the animals described in D. Data are shown as mean ± SD. ***P < 0.001, 1-way ANOVA followed by Bonferroni’s post hoc test. (F) Representative immunohistochemical staining for Ki67 and stromal α-SMA in tumor tissues obtained from each experimental group. Dot plots show the mean value for the percentage of Ki67 or stromal α-SMA–positive cells with statistical evaluation (n = 5–6). Data are shown as mean ± SEM. n = 3 independent experiments. **P < 0.01; ***P < 0.001, 1-way ANOVA followed by Bonferroni’s post hoc test.

