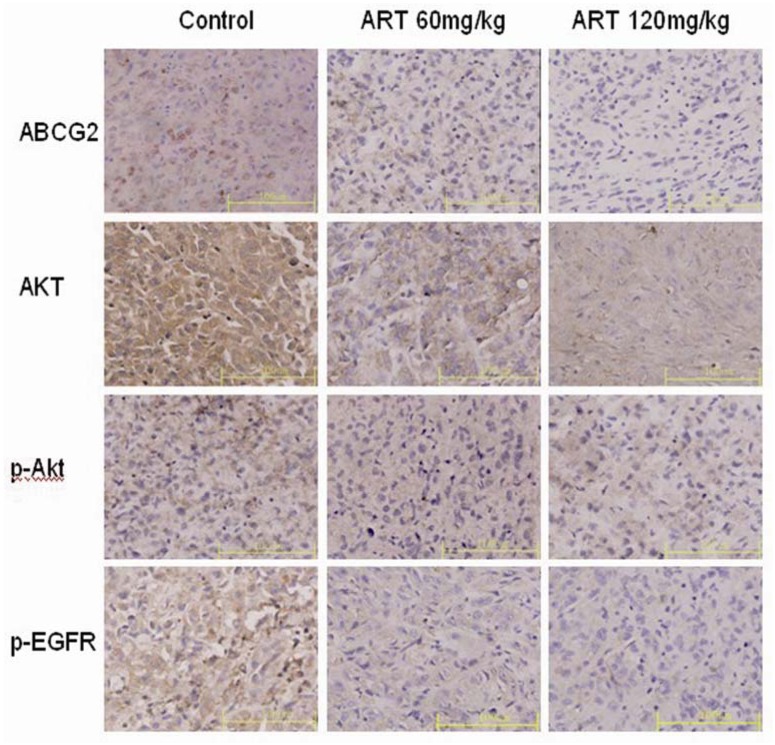
Figure 4.
The expression of ABCG2, Akt, p-Akt and p-EGFR proteins was examined in untreated and ART-treated (60 mg·kg−1 and 120 mg·kg−1) xenografts. Photographs of immunohistochemical staining for ABCG2, Akt, p-Akt and p-EGFR (×40) are shown. A distinct yellow stain can be observed in the membrane and cytoplasm. The images presented are representative of three independent experiments. The data are the means ± SE from three independent experiments performed in triplicate. * p < 0.05 compared with the control group. Bars, 100 μm.

