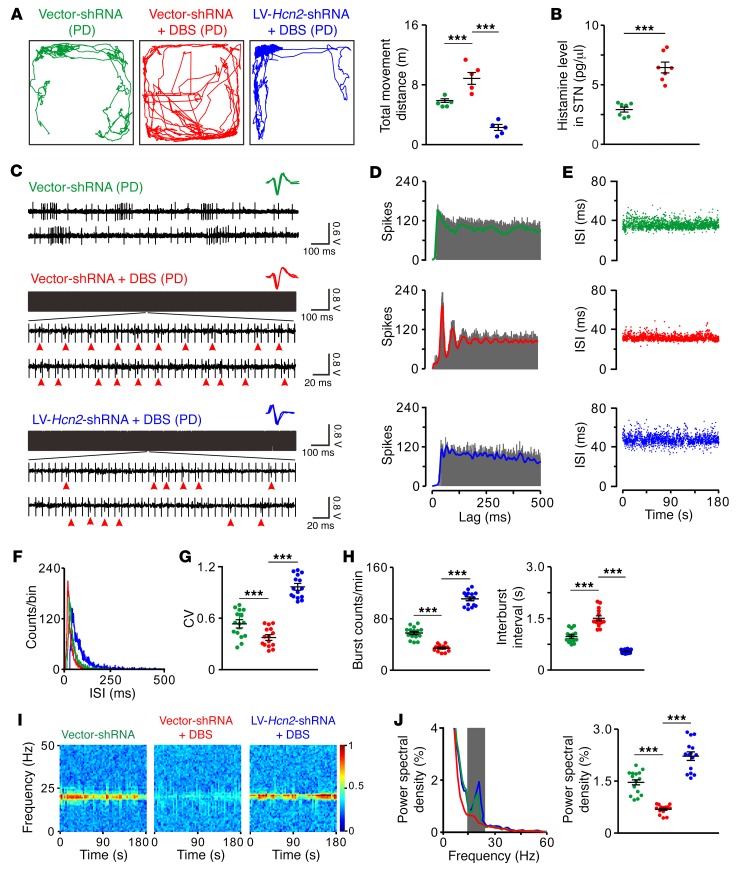
Figure 7. Downregulation of HCN2 attenuates STN-DBS–induced amelioration of motor dysfunction, firing patterns, and β oscillations in free-moving PD rats.
(A) Locomotor traces of PD rats in an open field. STN-DBS increased total movement distance of PD rats, whereas downregulation of HCN2 in STN abolished DBS-induced motor amelioration (n = 5). (B) STN-DBS increased histamine release in STN of PD rats in open field (n = 7). (C) Three continuous oscilloscope traces show firings of 3 STN neurons in free-moving PD rats treated with control virus, control virus plus STN-DBS, or downregulation of HCN2 virus plus STN-DBS. Red arrowheads indicate firing spikes of recorded STN neurons during DBS. Insets represent 5 superimposed traces of spike waveforms for each unit. (D–F) Autocorrelation histograms, scatter plots of ISI series, and ISI histograms of 3 STN neurons presented in C. (G and H) STN-DBS decreased CV of ISIs and number of bursts and increased interburst intervals of STN neurons in free-moving PD rats, whereas downregulation of HCN2 blocked STN-DBS–induced regularization of neuronal firing patterns (n = 15). (I) Power spectrograms of simultaneously recorded local field potentials in STN of these free-moving PD rats in the open field. (J) Power spectral distribution of local field potentials recorded from STN. Gray box indicates the classic β band (15–25 Hz). A clear increase of power in the β band was found in the PD rats. STN-DBS significantly alleviated dominant β band oscillatory activities in PD rats, whereas downregulation of HCN2 abolished STN-DBS–induced suppression of excessive β oscillations (n = 15). Data are represented as mean ± SEM. ***P < 0.001, 1-way ANOVA with Newman-Keuls post hoc test (A, G, H, and J) and 2-tailed paired t test (B).

