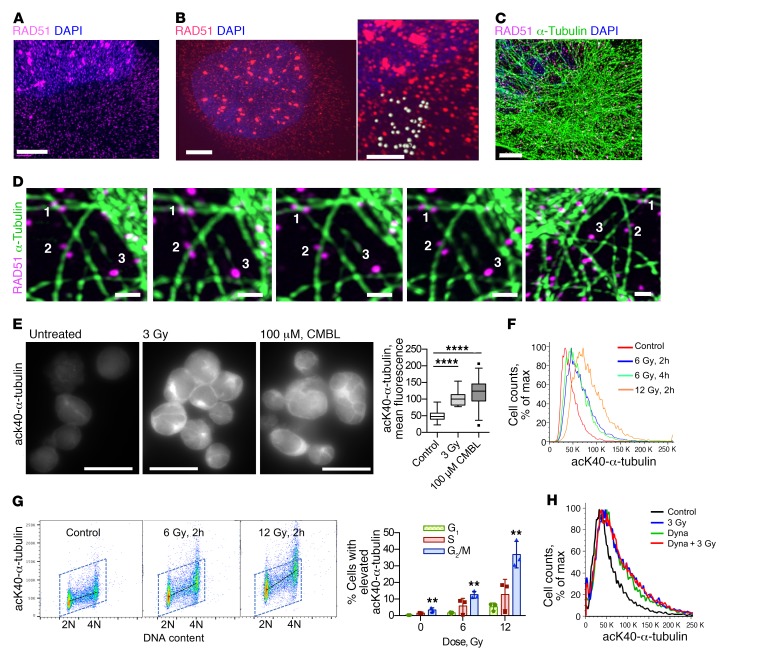
Figure 4. Response to DNA damage changes tubulin dynamics and involves DNM 2.
(A and B) Super-resolution microscopy analysis reveals a discrete punctate pattern of Rad51 in cytoplasm and nucleus. Human MDA-MB-231-BR3 (A) and CHO AA8 (B) cells fixed at 2 hours after 3 Gy show Rad51 foci in the nucleus. Note the much smaller Rad51 dots in both the cytoplasm and the nucleus. Scale bars: 3 μm. B, right: Higher-magnification image taken from the same cell as in the left panel; scale bar: 1 μm. Estimation of Rad51 dot size: light gray spheres drawn around Rad51 dots have an average diameter of 280 ± 50 nm. (C) Super-resolution microscopy images of MDA-MB-231-BR3 cells show that Rad51 associates with microtubules in unperturbed cells. Scale bar: 3 μm. (D) 3D super-resolution analysis: images of the same Rad51 vesicles (white numbers) viewed from different angles. Numbers correspond to the same objects. Scale bars: 1 μm. (E) Lysine 40 (K40) α-tubulin acetylation is increased after DNA damage in human B lymphoma cell line PW. Left: Representative images. Scale bars: 20 μm. CMBL, chlorambucil. Right: Quantification of the fluorescence intensity per cell. (F) K40 α-tubulin acetylation increases after DNA damage. FACS of CHO AA8 cells fixed 2 and 4 hours after treatment with x-rays. (G) FACS analysis of K40 α-tubulin acetylation in CHO AA8 cells shows that G2/M-phase cells compared with G1 have the highest increase in tubulin acetylation after radiation. Left: Representative dot plots. Right: Quantification. Shown are means ± SDs from n = 3 experiments. (H) FACS analysis of CHO AA8 cells irradiated with 3 Gy in the absence and presence of the dynamin 2 (DNM2) inhibitor dynasore. (E and G) Significance analysis: ANOVA. **P < 0.01, ****P < 0.0001.

