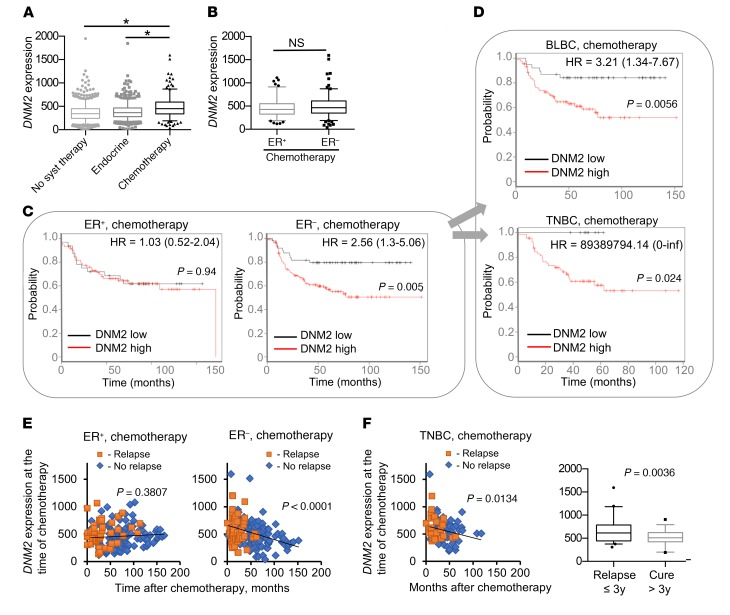
Figure 9. DNM2 expression predicts chemotherapy outcome for ER– breast cancer patients.
(A) DNM2 expression in 1,000 systemically untreated patients, 752 patients treated with endocrine therapy, and 274 breast cancer patients treated with chemotherapy. *P < 0.05, ANOVA. (B) DNM2 expression levels are not significantly different between chemotherapy-treated ER+ and ER− tumors. P = 0.167, Mann-Whitney test. (C and D) Decreased DNM2 is associated with better chemotherapy outcome in ER− patients. Patients were split by median expression of DNM2 over the entire breast cancer data set (3,455 patients). Patients with higher than median expression of DNM2 are denoted in red, and those with lower than median expression of DNM2 are in black. Note the hazard ratio increase in the ER−, but not in the ER+, group. (C) Kaplan-Meier analysis of 105 patients with ER+ breast tumors treated with chemotherapy and 169 patients with ER− breast tumors treated with chemotherapy. (D) Kaplan-Meier analysis of 125 patients with BLBC and 76 patients with TNBC. (E) Longer disease-free survival after chemotherapy is associated with lower tumor DNM2 levels at the time of chemotherapy in ER− patients, but not in ER+ patients. Patients diagnosed with disease recurrence at the time of follow-up are designated as “Relapse,” and those remaining disease-free at the time of follow-up as “No relapse.” (F) Longer disease-free survival after chemotherapy is associated with lower tumor DNM2 levels at the time of chemotherapy in TNBC patients. Box plot: TNBCs that relapse during the first 3 years after treatment have significantly higher DNM2 than those that do not relapse or relapse later. (E and F) Linear regression analysis: P < 0.05 indicates that the slope is significantly non-zero. (A, B, and F) The boxes and whiskers contain points within the 25th to 75th and the 5th to 95th percentiles, respectively.

