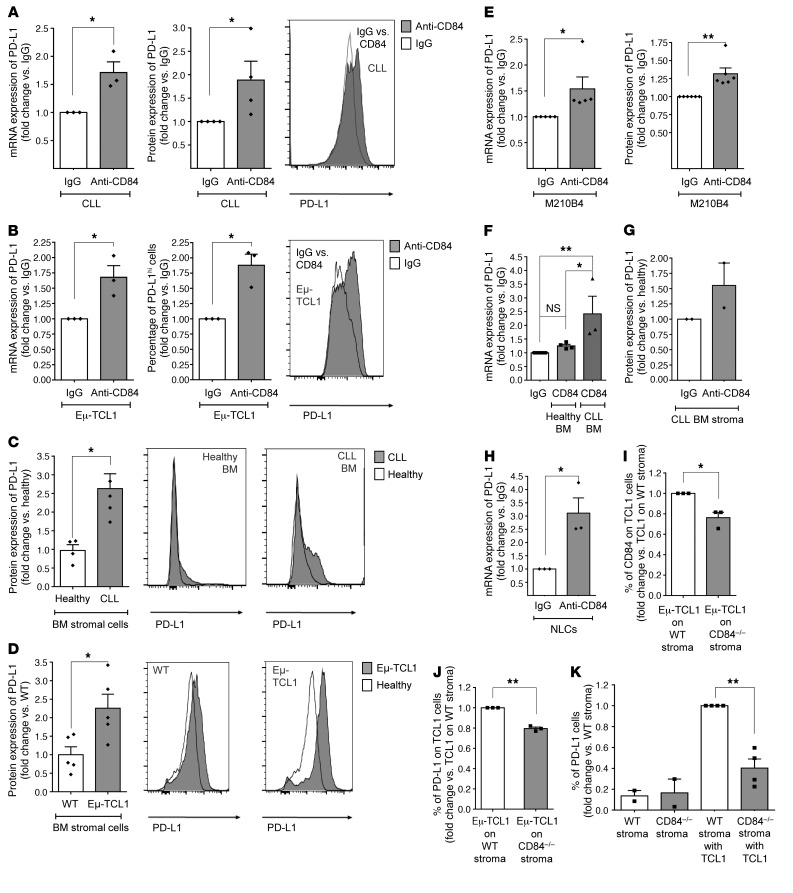
Figure 1. CD84 regulates PD-L1 expression on human and murine CLL cells and cells in their microenvironment.
(A and B) CLL cells derived from patients (at different stages of disease: n = 3 Binet A, n = 1 Binet B, n = 1 Rai II, n = 1 Binet C, and n = 1 Rai III) (A) or from Eμ-TCL1 CLL mice (B) were stimulated with anti-CD84 or control IgG (5 μg/ml) antibodies, and PD-L1 mRNA and protein levels were determined by qRT-PCR and flow cytometry, respectively. *P < 0.05, 1-tailed, paired t test (A, right), 2-tailed, paired t test (A, left, and B). n = 3 (A) and n = 4 (B). Representative histograms are shown. (C and D) BM stromal cells derived from human CLL samples (n = 4) and healthy patients (n = 4) (C), or Eμ-TCL1 (n = 5) and healthy (n = 5) mice (D) were analyzed by FACS for PD-L1 expression levels. Representative histograms are shown. IgG is shown in white and anti-CD84 in gray. *P < 0.05, 2-tailed, paired t test (C and D). (E) M210B4 stromal cells were stimulated with IgG or anti-CD84 (4 μg/ml) antibody for 24 or 48 hours. PD-L1 mRNA levels were analyzed by qRT-PCR (n = 5), and protein levels were analyzed by flow cytometry (n = 6). *P < 0.05, 2-tailed, paired t test and **P < 0.01, 1 tailed, paired t test. (F–H) BM stromal cells derived from healthy volunteers or CLL patients (F and G) or human NLCs (H) were stimulated with 4 μg/ml anti-CD84 or control antibodies for 24 hours for mRNA expression or 48 hours for protein expression. PD-L1 mRNA levels were analyzed by qRT-PCR using PSMB as a housekeeping control gene (n = 3), and protein levels were determined by flow cytometry (n = 2). *P < 0.05 and **P < 0.01, 1-way ANOVA with Holm-Sidak–corrected multiple comparisons (F) and 2-tailed, paired t test (H). (I–K) Eμ-TCL1 splenocytes were seeded on near-confluent WT or CD84–/– stroma. Forty-eight hours later, protein levels of CD84 and PD-L1 were measured on TCL1 (gated on CD5+CD19+) cells (I and J) and on stroma before and after addition of TCL1 cells (K). n = 3–4 TCL1 mice. *P < 0.05 and **P < 0.01, 2-tailed, paired t test.

