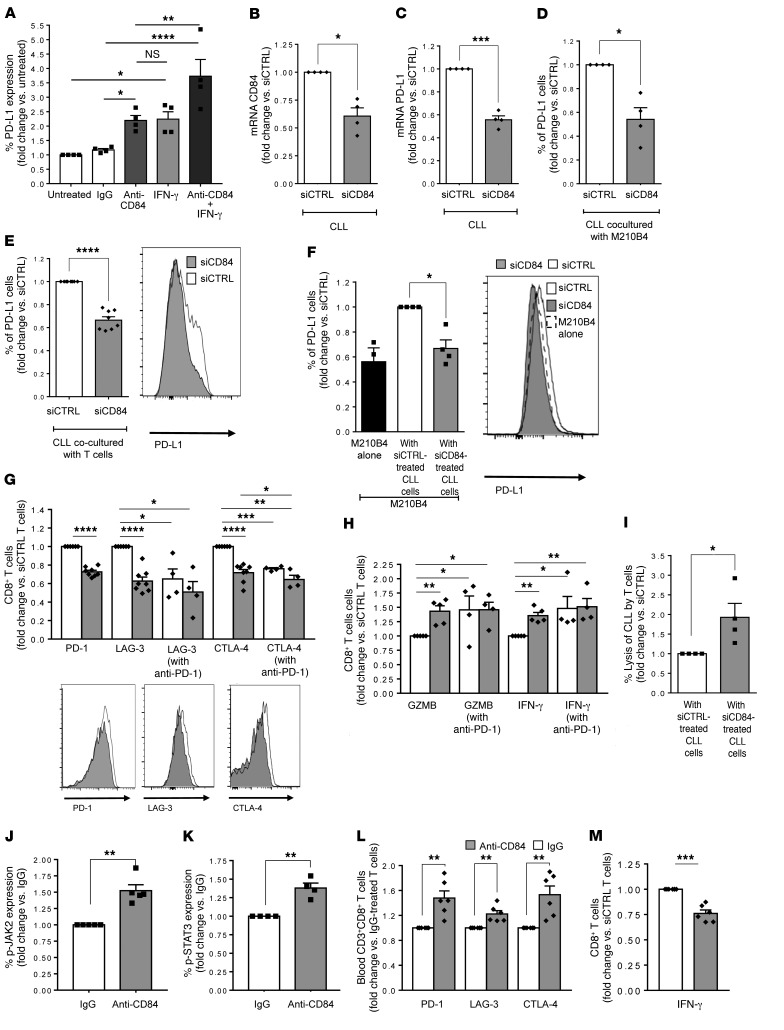
Figure 6. Downregulation of CD84 expression in human CLL reduces PD-L1 on CLLs and stroma and induces T cell activity.
(A) Primary human CLL cells were incubated for 48 hours in the presence or absence of anti-CD84–activating or control (IgG) (5 μg/ml) antibodies, IFN-γ (500 IU/ml), or both treatments together. Cells were then analyzed by FACS for PD-L1 cell-surface expression (n = 4; *P < 0.05 , **P < 0.01, and ****P < 0.0001, 1-way ANOVA with Holm-Sidak–corrected multiple comparisons). (B and C) CLL cells were treated with siCTRL or siCD84 for 24 hours, and levels of (B) CD84 (n = 4; *P < 0.05) and (C) PD-L1 (n = 4–5; ***P < 0.001, 2-tailed, paired t test) were analyzed. (D–F) The siRNA-treated cells were then incubated for 48 hours with M210B4 (D and F), or T cells (E, G, and H) derived from the same patient. (D and E) PD-L1 cell-surface expression on CLL cells derived from the coculture was analyzed by FACS. E shows a representative histogram. n = 4, *P < 0.05 (D) and n = 11, ****P < 0.0001 (E), 2-tailed, paired t test. (F) M210B4 cells were stained for PD-L1 cell-surface expression. A representative histogram is shown (n = 4; *P < 0.05, 2-tailed, paired t test). (G and H) CLL cells were treated with siCTRL or siCD84. The siRNA-treated cells were then incubated in the presence or absence T cells treated with anti–PD-1–blocking antibody (5 μg/ml) for 24 hours prior to coculture. (G) CD8+ T cells were analyzed for expression of the exhaustion markers PD-1, LAG-3, and CTLA-4 (n = 4). Representative histograms are shown in G. *P < 0.05, **P < 0.01, ***P < 0.001, and ****P < 0.0001, 2-tailed, paired t test for siCTRL and siCD84, and 1-way ANOVA with Fisher’s least significant difference (LSD) for the others. (H) Cultures were incubated with anti-CD3 (0.5 μg/ml) and brefeldin A for the last 2 hours. T cells were then analyzed for GZMB and IFN-γ expression. Graph show the percentage of CD8+ T cells that expressed GZMB and IFN-γ with and without PD-1 inhibition (5 μg/ml, clone EH12.2H7) (n = 4; *P < 0.05 and **P < 0.01, 2-tailed, paired t test for siCTRL and siCD84, and 1-way ANOVA with Fisher’s LSD for the others). (I) CLL cell lysis by the T cells in B was determined with the CytoTox-ONE Kit (Promega) (n = 4; *P < 0.05, 2-tailed, paired t test). (J–M) Purified human T cells were treated with anti-CD84 (5 μg/ml) and analyzed for p-JAK2 (I), p-STAT3 (K), PD-1, LAG-3, and CTLA-4 (L), and IFN-γ expression (M) (n = 4–6; **P < 0.01 and ***P < 0.001, 2-tailed, paired t test).

